. 2012 Nov 28;32(48):17287-96.
doi: 10.1523/JNEUROSCI.3565-12.2012.

Mechanisms generating dual-component nicotinic EPSCs in cortical interneurons

Affiliations

Mechanisms generating dual-component nicotinic EPSCs in cortical interneurons

Corbett Bennett et al. J Neurosci. .

Abstract

Activation of cortical nicotinic receptors by cholinergic axons from the basal forebrain (BF) significantly impacts cortical function, and the loss of nicotinic receptors is a hallmark of aging and neurodegenerative disease. We have previously shown that stimulation of BF axons generates a fast α7 and a slow non-α7 receptor-dependent response in cortical interneurons. However, the synaptic mechanisms that underlie this dual-component nicotinic response remain unclear. Here, we report that fast α7 receptor-mediated EPSCs in the mouse cortex are highly variable and insensitive to perturbations of acetylcholinesterase (AChE), while slow non-α7 receptor-mediated EPSCs are reliable and highly sensitive to AChE activity. Based on these data, we propose that the fast and slow nicotinic responses reflect differences in synaptic structure between cholinergic varicosities activating α7 and non-α7 classes of nicotinic receptors.


Figures

Figure 1.
Figure 1.
Dual-component nicotinic EPSCs in L1 interneurons. A, Dual-component synaptic response of an L1 interneuron to photostimulation of cholinergic fibers recorded under current clamp. Inset, Fast component depicted on expanded timescale. This cell was not included in Arroyo et al., 2012. B, Synaptic response recorded from the same neuron as in A under voltage clamp. Inset, Expanded timescale. C, Dual-component response in an L1 interneuron before (black) and after (gray) application of TTX (0.5 μm). Inset, Fast component depicted on expanded timescale. D, Amplitude of the slow (left; n = 9) and fast (right; n = 6) EPSCs before and after application of TTX. *p < 0.05, Wilcoxon signed-rank test. Overlapping data points were horizontally offset for clarity. A–D, Black circles and tick marks represent photostimulation.
Figure 2.
Figure 2.
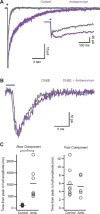
Fast and slow nicotinic EPSCs are differentially impacted by blockade of AChE. A, Dual-component nicotinic EPSC of an L1 interneuron before (gray) and after (purple) application of the AChE inhibitor ambenonium dichloride (100 nm). Inset, Expanded timescale. B, Fast component of a L1 interneuron after selectively abolishing the slow component with DHβE (500 nm; gray) and subsequently applying ambenonium (100 nm; purple). C, Left, Time from peak current to half amplitude for the slow EPSC recorded in control ACSF (n = 8) and ambenonium (Amb.; n = 7). Right, Time from peak current to half amplitude for the fast EPSC recorded in control ACSF (n = 8) and ambenonium (n = 7). *p < 0.001, Wilcoxon rank-sum test. A–C, Blue circles and tick marks represent photostimulation.
Figure 3.
Figure 3.
Fast and slow nicotinic EPSCs are differentially impacted by application of exogenous AChE. A, Schematic illustrating experimental setup. Whole-cell recordings were obtained from L1 cells while photostimulating cholinergic fibers and pressure ejecting AChE or ACSF via a second patch pipette. B, Dual-component nicotinic response of an L1 interneuron before (gray) and after (purple) application of AChE (0.4 U/μl). Inset, Expanded timescale. C, Dual-component nicotinic response of an L1 interneuron before (gray) and after (purple) application of ACSF. Inset, Expanded timescale. D, Amplitude of slow (left) and fast (right) components plotted for nine L1 interneurons under control, puff, and wash conditions. *p < 0.01, Wilcoxon rank-sum test. A–D, Blue circles and tick marks represent photostimulation.
Figure 4.
Figure 4.
Concentration dependence of α7 receptor-mediated response kinetics. A, Differential interference contrast image depicting rapid application of ACh onto a nucleated patch from an L1 interneuron. Arrow indicates boundary of agonist stream. B, Response to an 8 ms application of ACh (300 μm) in a nucleated patch from an L1 interneuron (black) is blocked by MLA (5 nm; gray). C, Left, Nucleated patch responses to rapid application of ACh (5 ms) at eight holding potentials between −70 and +50 mV. Right, I–V plot for same patch. D, Decay τs of responses to rapid application of ACh plotted as a function of concentration. Rapid application was performed on nucleated patches from L1 interneurons. Solid line represents a linear fit to the data plotted on a log–log scale. Dotted lines indicate the range of decay τs from α7-mediated synaptic responses, plotted individually as open circles to the right. Error bars are 1 SD. E, Top, Average response of a nucleated patch from an L1 interneuron to rapid application of 50 μm ACh. Black bar, Duration of agonist application (50 ms). Bottom, Synaptic response in an L1 interneuron to photostimulation of cholinergic fibers demonstrating the time course of the fast component. Black bar represents photostimulation.
Figure 5.
Figure 5.
Paired-pulse depression is similar for fast and slow EPSCs. A, Left, Example of paired-pulse depression in one L1 cell at an interstimulus interval of 1 s. Blue dots represent photostimulation. Right, PPR curves for the fast component (black squares) and the slow component (red circles). Each data point represents the average paired-pulse ratio for several L1 cells. Solid lines indicate exponential fits to PPR curves with 95% confidence intervals represented by shading. B, Left, Example of paired-pulse depression at three interstimulus intervals for one L1 interneuron nucleated patch. Right, PPR data for nine patches. Each symbol represents data from one patch. For time course comparison, the exponential fit for the fast synaptic PPR data has been replotted (black) on this shorter time scale.
Figure 6.
Figure 6.
Fast and slow nicotinic EPSCs exhibit different response variability. A, Responses of three L1 interneurons labeled 1–3 in B. B, Amplitudes of the fast and slow nicotinic EPSCs were plotted for 39 L1 interneurons. Each symbol represents one cell. Red symbols highlight the cells for which no fast EPSC was detected. C, Single-trial amplitudes of the fast and slow nicotinic EPSCs were plotted for two cells. Red symbols represent response amplitudes for the cell displayed in E and F. D, The coefficient of variation for the fast component (n = 6 cells) was significantly greater than the coefficient of variation for the slow component (n = 5 cells). *p < 0.01, Wilcoxon rank-sum test. E, Expanded time scale of a dual-component nicotinic response for the same cell as in C. Seven individual responses are displayed; red traces represent trials in which the fast component failed. The gradual slope in all five traces represents the rise of the slow component. F, Dual-component nicotinic response for the same cell as in C. Responses containing only a slow component (left) and responses containing both a fast and slow component (middle) were averaged separately and superimposed (right). A–F, Blue circles and tick marks represent photostimulation.
Figure 7.
Figure 7.
Proposed model for cortical cholinergic synapses. Based on our data, we propose the following model for cholinergic synapses onto cortical interneurons: α7 nicotinic receptors are located primarily at synaptic contacts between cholinergic axons and cortical interneuron dendrites, while non-α7 nicotinic receptors are located extrasynaptically, where they sample release from multiple cholinergic varicosities. The varicosities serving both responses are independent but exhibit similar release properties.

References

    1. Alkondon M, Pereira EF, Albuquerque EX. alpha-bungarotoxin- and methyllycaconitine-sensitive nicotinic receptors mediate fast synaptic transmission in interneurons of rat hippocampal slices. Brain Res. 1998;810:257–263. - PubMed
    1. Arroyo S, Bennett C, Aziz D, Brown SP, Hestrin S. Prolonged disynaptic inhibition in the cortex mediated by slow, non-alpha7 nicotinic excitation of a specific subset of cortical interneurons. J Neurosci. 2012;32:3859–3864. - PMC - PubMed
    1. Bell KA, Shim H, Chen CK, McQuiston AR. Nicotinic excitatory postsynaptic potentials in hippocampal CA1 interneurons are predominantly mediated by nicotinic receptors that contain alpha4 and beta2 subunits. Neuropharmacology. 2011;61:1379–1388. - PMC - PubMed
    1. Birks J, Harvey RJ. Donepezil for dementia due to Alzheimer's disease. Cochrane Database Syst Rev. 2003;2006:CD001190. - PubMed
    1. Buisson B, Gopalakrishnan M, Arneric SP, Sullivan JP, Bertrand D. Human alpha4beta2 neuronal nicotinic acetylcholine receptor in HEK 293 cells: a patch-clamp study. J Neurosci. 1996;16:7880–7891. - PMC - PubMed

Publication types

MeSH terms

LinkOut - more resources