. 2013 Feb;161(2):705-24.
doi: 10.1104/pp.112.209254. Epub 2012 Nov 29.

An RNA-Seq transcriptome analysis of orthophosphate-deficient white lupin reveals novel insights into phosphorus acclimation in plants

Affiliations

An RNA-Seq transcriptome analysis of orthophosphate-deficient white lupin reveals novel insights into phosphorus acclimation in plants

Jamie A O'Rourke et al. Plant Physiol. 2013 Feb.

Abstract

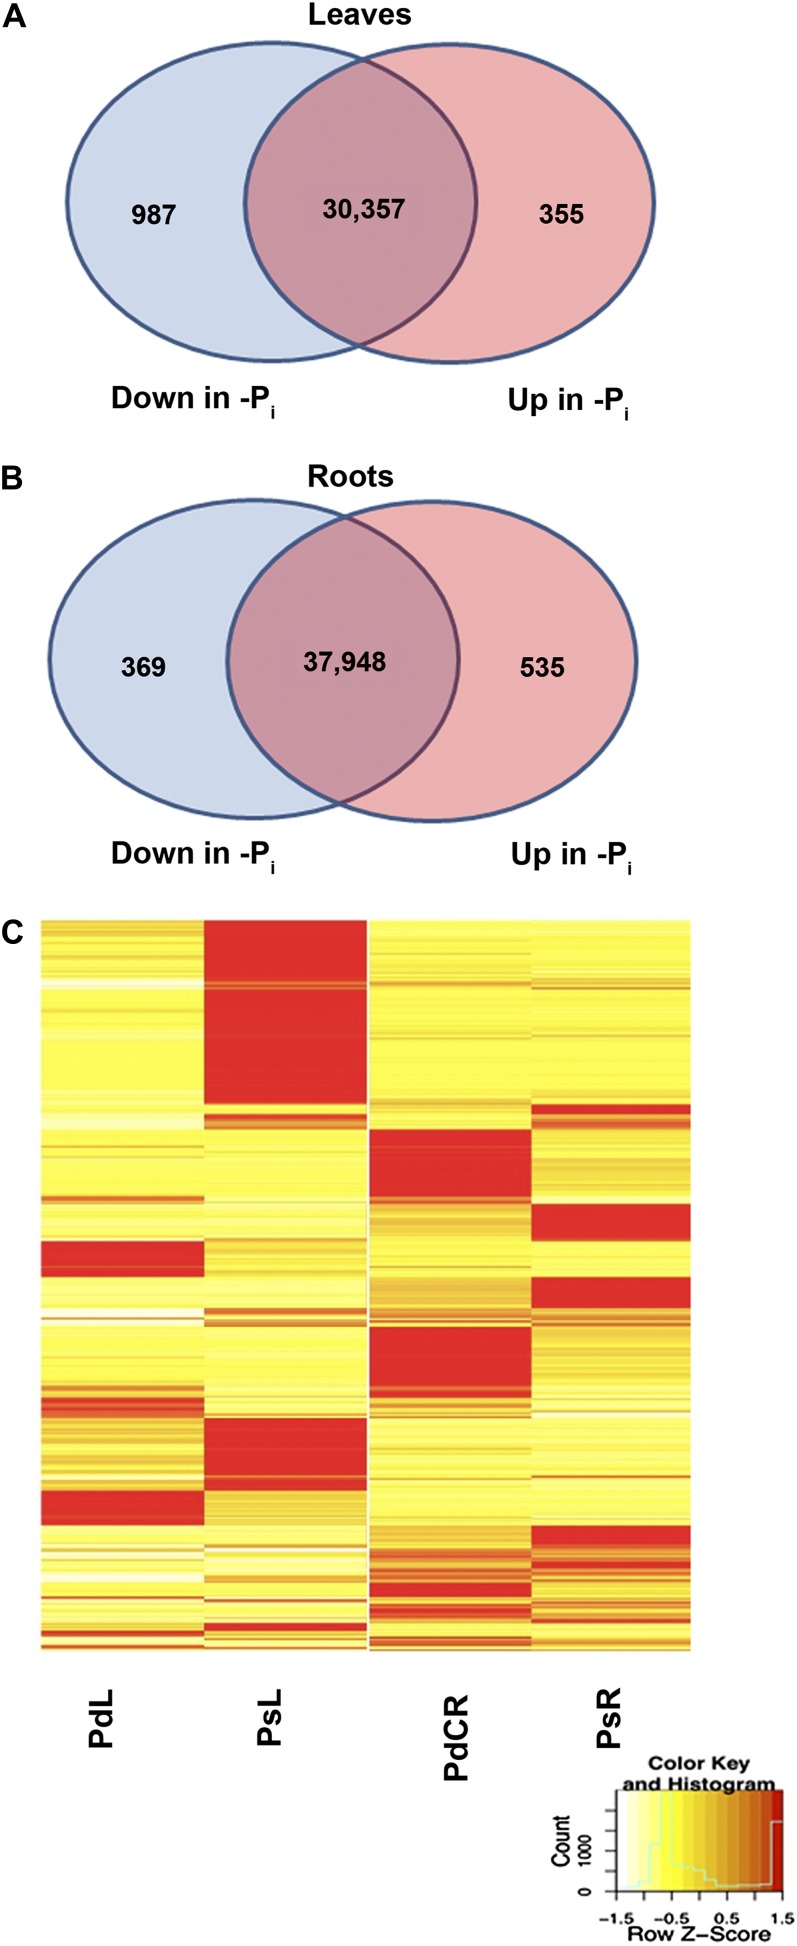
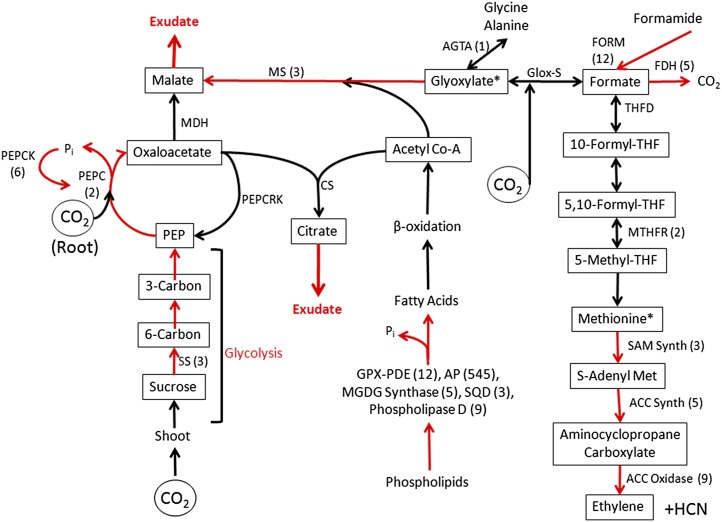
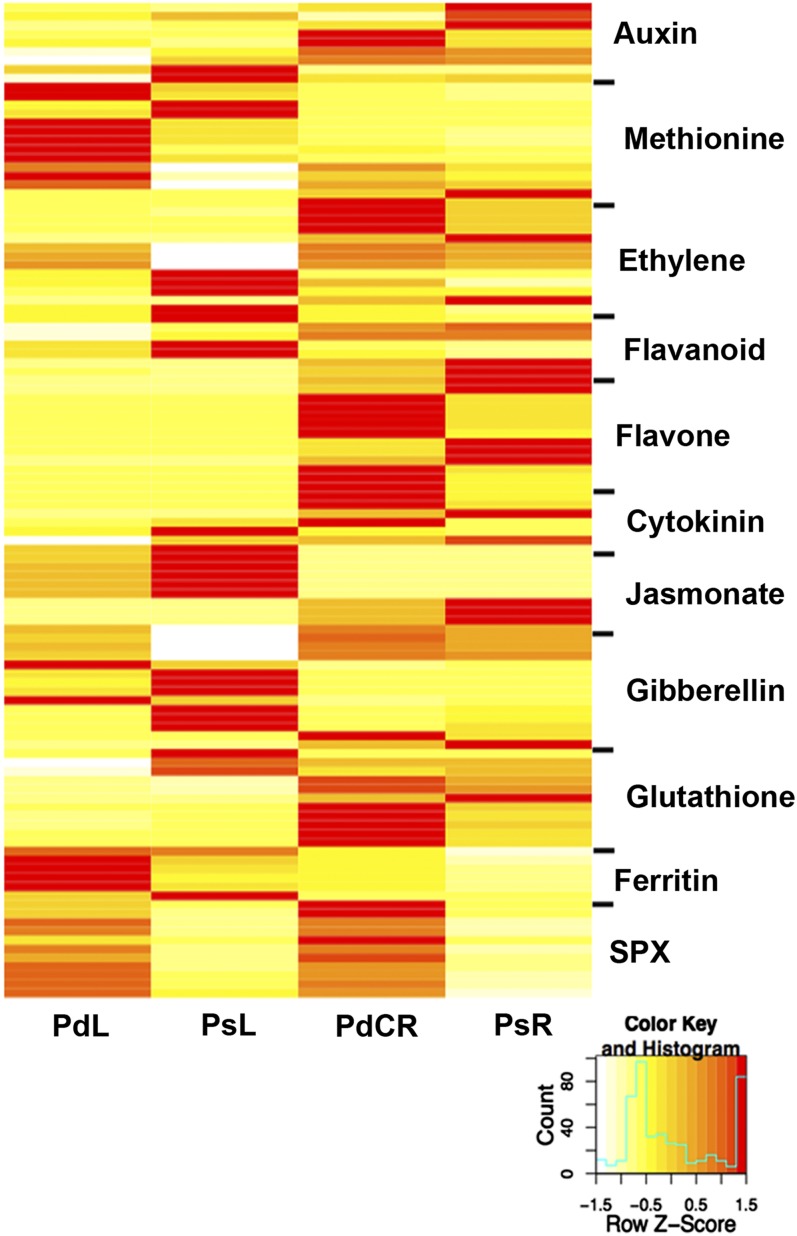
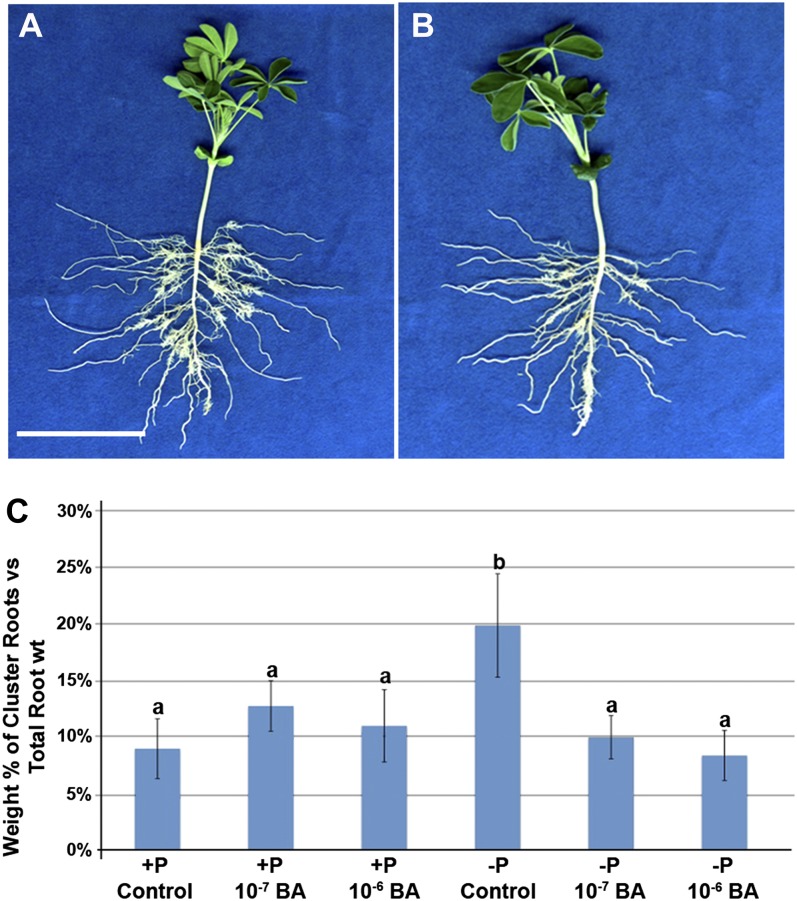
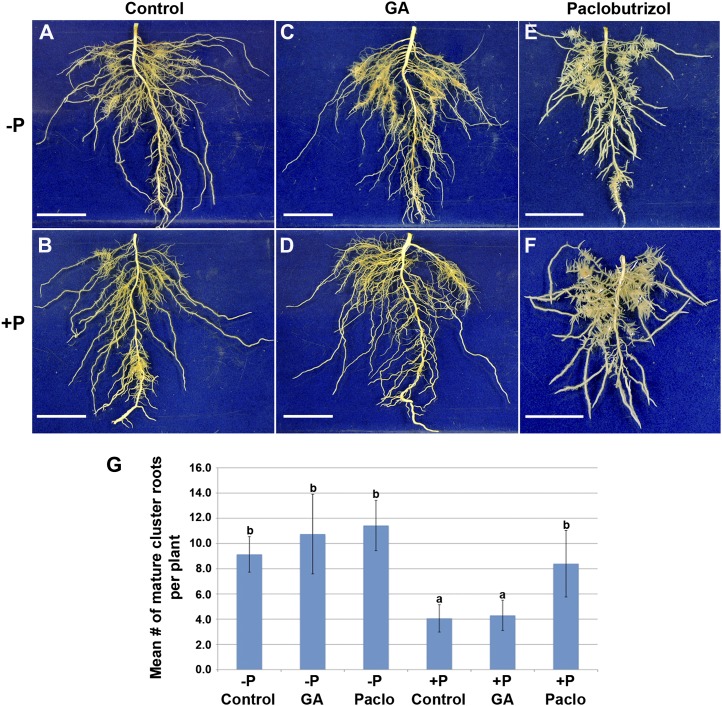
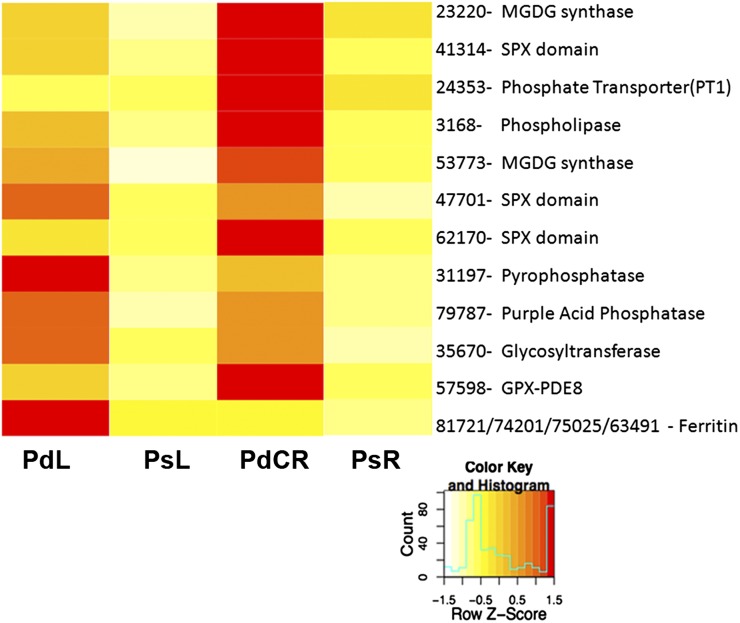
Phosphorus, in its orthophosphate form (P(i)), is one of the most limiting macronutrients in soils for plant growth and development. However, the whole-genome molecular mechanisms contributing to plant acclimation to P(i) deficiency remain largely unknown. White lupin (Lupinus albus) has evolved unique adaptations for growth in P(i)-deficient soils, including the development of cluster roots to increase root surface area. In this study, we utilized RNA-Seq technology to assess global gene expression in white lupin cluster roots, normal roots, and leaves in response to P(i) supply. We de novo assembled 277,224,180 Illumina reads from 12 complementary DNA libraries to build what is to our knowledge the first white lupin gene index (LAGI 1.0). This index contains 125,821 unique sequences with an average length of 1,155 bp. Of these sequences, 50,734 were transcriptionally active (reads per kilobase per million reads ≥ 3), representing approximately 7.8% of the white lupin genome, using the predicted genome size of Lupinus angustifolius as a reference. We identified a total of 2,128 sequences differentially expressed in response to P(i) deficiency with a 2-fold or greater change and P ≤ 0.05. Twelve sequences were consistently differentially expressed due to P(i) deficiency stress in three species, Arabidopsis (Arabidopsis thaliana), potato (Solanum tuberosum), and white lupin, making them ideal candidates to monitor the P(i) status of plants. Additionally, classic physiological experiments were coupled with RNA-Seq data to examine the role of cytokinin and gibberellic acid in P(i) deficiency-induced cluster root development. This global gene expression analysis provides new insights into the biochemical and molecular mechanisms involved in the acclimation to P(i) deficiency.


Figures

Figure 1.
Figure 1.
Transcripts differentially expressed due to Pi. A total of 2,128 transcripts were identified as differentially expressed between Pi-sufficient and Pi-deficient tissues. To be considered differentially expressed, the transcript must have RPKM ≥ 3 in at least one tissue, 2-fold or greater change between tissues, and P ≤ 0.05. A, A total of 1,342 transcripts differentially expressed due to Pi in leaves. B, A total of 904 transcripts differentially expressed due to Pi in roots. C, Heat map of Z scores (number of sd) illustrating expression profiles of 2,128 transcripts differentially expressed due to Pi. Red indicates high expression, yellow indicates intermediate expression, and white indicates low expression. See also Supplemental Tables S1 and S2.
Figure 2.
Figure 2.
Adjustments in root metabolism promote acclimation to Pi deficiency. Shown are modifications in white lupin cluster root metabolism that facilitate acclimation to Pi deficiency as evidenced by transcript expression. Increased expression in PdCR was confirmed by qPCR as indicated by fold change in parentheses. Red arrows represent genes known to be up-regulated due to Pi deficiency. Increased Suc metabolism via glycolysis and organic acid production provide carbon for malate and citrate exudation into the rhizosphere. Organic acids lost through exudation are replenished through anaplerotic pathways involving phosphoenolpyruvate carboxylase (PEPC) and a glyoxylate-like cycle malate synthase (MS). One-carbon metabolism is enhanced through a formate and THF pathway. The THF pathway contributes to Met and ethylene production. Increased expression of transcripts involved in phospholipid degradation releases Pi for recycling and carbon for acetyl-CoA synthesis. Acetyl-CoA and glyoxylate provide carbon for malate synthesis through malate synthase. Formate may be carboxylated to glyoxylate by a putative glyoxylate synthase (Glox-S). Additional abbreviations are as follows: Suc synthase (SS); phosphoenolpyruvate carboxylase kinase (PEPCK); phosphoenolpyruvate carboxylase carboxykinase (PEPCRK); malate dehydrogenase (MDH); citrate synthase (CS); formamidase (FORM); formate dehydrogenase (FDH); Ala glyoxylate transaminase (AGTA); THF deformylase (THFD); methylene-THF reductase (MTHFR); S-adenosyl-Met synthase (SAM Synth); aminocyclopropane synthase (ACC Synth); aminocyclopropane oxidase (ACC Oxidase); phospholipase A (PLA1); glycerophosphodiester-phosphodiesterase (GPX-PDE); acid phosphatase (AP); monogalactosyldiacylglycerol synthase (MGDG synthase); sulfoquinovosyltransferase (SQD).
Figure 3.
Figure 3.
Heat map of expression profiles of transcripts involved in acclimation to Pi deficiency. Expression, represented by Z scores, is shown for selected transcripts differentially expressed due to Pi deficiency. To be considered differentially expressed, the transcript must have RPKM ≥ 3 in at least one tissue, 2-fold or greater change between tissues, and P ≤ 0.05. Red indicates high expression, yellow indicates intermediate expression, and white indicates low expression. Transcripts have been grouped by function to clarify the role of each group in the Pi deficiency response. For more details, see Supplemental Table S8.
Figure 4.
Figure 4.
CK application impairs Pi stress-induced cluster root formation. All root samples were collected at 14 DAE of shoots from quartz/sand growth medium. CK-treated plants were given 10−6 or 10−7 m BA at 3, 6, and 8 DAE. A, Pi-deficient control plant. Bar = 10 cm. B, Pi-deficient plant treated with 10−6 m BA. Note the reduction in cluster roots on the BA-treated plant. C, BA application reduces the percentage of root weight of cluster roots from 20% in Pi-deficient control plants (b) to approximately 10% (±se), comparable to those of Pi-sufficient plants (a). Columns with the same lowercase letter are not significantly different (P = 0.05).
Figure 5.
Figure 5.
Effects of GA3 and Paclo on white lupin cluster root development. All root samples were collected at 14 DAE of shoots from quartz/sand growth medium. GA-treated plants were treated with 10−6 m GA at 3, 6, 9, and 12 DAE. Paclo-treated plants were given 1 mg of Paclo (per each 6-L pot) at 5 DAE. A and B, Roots of Pi-sufficient and Pi-deficient control plants. C and D, Roots of Pi-sufficient and Pi-deficient plants treated with 10−6 m GA. E and F, Roots of Pi-sufficient and Pi-deficient plants treated with Paclo. Bars = 5 cm. G, Mean number of cluster roots per plant (±se). Note that Paclo-treated Pi-sufficient plants have increased cluster root formation mimicking that of Pi-deficient plants. GA had no effect on mean cluster root number but does appear to decrease rootlet density (Supplemental Fig. S7). Columns with the same lowercase letter are not significantly different (P = 0.05).
Figure 6.
Figure 6.
Candidate genes for use as Pi deficiency indicators. The heat map illustrates the expression pattern, represented by Z scores, in our lupin RNA-Seq data of sequences identified as differentially expressed in multiple microarray experiments and lupin RNA-Seq data due to Pi deficiency. Red indicates high expression, yellow indicates intermediate expression, and white indicates low expression. All transcripts, except the ferritin sequences, are up-regulated in PdCR. Transcripts 47701, 31197, 79787, 35670, and multiple ferritin sequences are up-regulated in PdL.

References

    1. Allan WL, Clark SM, Hoover GJ, Shelp BJ. (2009) Role of plant glyoxalate reductases during stress: a hypotheses. Biochem J 42: 15–22 - PMC - PubMed
    1. Amador V, Monte E, García-Martínez J-L, Prat S. (2001) Gibberellins signal nuclear import of PHOR1, a photoperiod-responsive protein with homology to Drosophila armadillo. Cell 106: 343–354 - PubMed
    1. Anders S, Huber W. (2010) Differential expression analysis for sequence count data. Genome Biol 11: R106. - PMC - PubMed
    1. Andersson MX, Stridh MH, Larsson KE, Liljenberg C, Sandelius AS. (2003) Phosphate-deficient oat replaces a major portion of the plasma membrane phospholipids with the galactolipid digalactosyldiacylglycerol. FEBS Lett 537: 128–132 - PubMed
    1. Bari R, Datt Pant B, Stitt M, Scheible W-R. (2006) PHO2, microRNA399, and PHR1 define a phosphate-signaling pathway in plants. Plant Physiol 141: 988–999 - PMC - PubMed

Publication types

MeSH terms

Associated data