. 2012 May;1(5):373-83.
doi: 10.5966/sctm.2011-0048. Epub 2012 May 3.

Cell therapy with human renal cell cultures containing erythropoietin-positive cells improves chronic kidney injury

Affiliations

Cell therapy with human renal cell cultures containing erythropoietin-positive cells improves chronic kidney injury

Liliya M Yamaleyeva et al. Stem Cells Transl Med. 2012 May.

Abstract

New therapeutic strategies for chronic kidney disease (CKD) are necessary to offset the rising incidence of CKD and donor shortage. Erythropoietin (EPO), a cytokine produced by fibroblast-like cells in the kidney, has recently emerged as a renoprotective factor with anti-inflammatory, antioxidant properties. This study (a) determined whether human renal cultures (human primary kidney cells [hPKC]) can be enriched in EPO-positive cells (hPKC(F+)) by using magnetic-bead sorting; (b) characterized hPKC(F+) following cell separation; and (c) established that intrarenal delivery of enriched hPKC(F+) cells would be more beneficial in treatment of renal injury, inflammation, and oxidative stress than unsorted hPKC cultures in a chronic kidney injury model. Fluorescence-activated cell sorting analysis revealed higher expression of EPO (36%) and CD73 (27%) in hPKC(F+) as compared with hPKC. After induction of renal injury, intrarenal delivery of hPKC(F+) or hPKC significantly reduced serum creatinine, interstitial fibrosis in the medulla, and abundance of CD68-positive cells in the cortex and medulla (p < .05). However, only hPKC(F+) attenuated interstitial fibrosis in the renal cortex and decreased urinary albumin (3.5-fold) and urinary tubular injury marker kidney injury molecule 1 (16-fold). hPKC(F+) also significantly reduced levels of renal cortical monocyte chemotactic protein 1 (1.8-fold) and oxidative DNA marker 8-hydroxy-deoxyguanosine (8-OHdG) (2.4-fold). After 12 weeks, we detected few injected cells, which were localized mostly to the cortical interstitium. Although cell therapy with either hPKC(F+) or hPKC improved renal function, the hPKC(F+) subpopulation provides greater renoprotection, perhaps through attenuation of inflammation and oxidative stress. We conclude that hPKC(F+) may be used as components of cell-based therapies for degenerative kidney diseases.


Figures

Figure 1.
Figure 1.
Phase contrast microscopy images and growth curves of hPKC and hPKC(F+) (A), the immunofluorescent staining (B), fluorescence-activated cell sorting (FACS) analysis for EPO (C), and the effects of 24 hours of hypoxia (3% oxygen) on EPO mRNA levels and protein release by cultured human renal cells (D). (A): The majority of cells in hPKC(F+) showed typical fibroblast-like morphology. The growth curves show that in 3 days both cell populations doubled their number. Overall, the cells were cultured for 15 days, and the population doubled approximately eight times. (B, C): Immunofluorescent staining (B) and FACS analysis (C) for EPO were performed in unfractionated hPKC (left panels) and sorted hPKC(F+) (right panels). (D): The mRNA data were obtained from three different experiments performed in triplicate and expressed as the ratio of EPO to glyceraldehyde-3-phosphate dehydrogenase (left panel). The mRNA data are means ± SE. ∗, p < .05 versus baseline at normoxic condition; n = 2–4. The release of EPO protein into conditioned media was determined using the human EPO tissue culture kit (SECTOR Imager 6000; Meso Scale Discovery). The data are expressed as mU/ml (right panel). Abbreviations: EPO, erythropoietin; hPKC, human primary kidney cell; hPKC(F+), human primary kidney cell containing erythropoietin-positive cells.
Figure 2.
Figure 2.
Characterization of hPKC and hPKC(F+) at passage 3 using fluorescence-activated cell sorting analysis. The positive staining for each marker is shown representing the comparison with the respective IgG control. Abbreviations: hPKC, human primary kidney cell; hPKC(F+), human primary kidney cell containing erythropoietin-positive cells.
Figure 3.
Figure 3.
Characterization of chronic kidney injury in the nude rat following IR combined with GM administration (A) and the indices of renal function and injury following intrarenal cell delivery in IR-GM rats (B–E). (A): Serum creatinine, hemoglobin, and urinary albumin are shown at 18 weeks after the final gentamicin injection as pooled data from all of the groups studied. The untreated group contains age-matched animals that did not receive the IR-GM treatment. All of the data are the means ± SE. Serum creatinine is expressed as mg/dl; ∗, p < .05 versus untreated group; n = 13–14. Hemoglobin is expressed as g/dl; ∗, p < .05 versus untreated group; n = 11–12. Urinary albumin is expressed as μg/day; ∗, p < .05 versus untreated group; n = 3–4. (B–E): Eighteen weeks post-IR-GM treatment, hPKC and hPKC(F+) at passage 3 were injected bilaterally into the lower pole of renal parenchyma at a concentration of 5 × 10⁶ cells per 100 μl per animal. rhEPO was delivered via an osmotic minipump at the dose of 100 IU/kg per day per rat. The vehicle group consisted of IR-GM rats that received bilateral intrarenal phosphate-buffered saline injections, the hPKC group contained IR-GM rats that received unsorted primary renal cultures into renal parenchyma, and the hPKC(F+) group consisted of IR-GM rats that received primary renal cell cultures enriched in erythropoietin-producing cells. All of the data are shown as the means ± SE. (B): A time course for serum creatinine following cell delivery. The data are expressed as mg/dl, n = 4–6; ∗, p < .05 versus untreated in all groups; #, p < .05 hPKC and PKC(F+) versus vehicle; &, p < .05 versus (F+) baseline. The dotted black line shows levels of serum creatinine in the untreated nude rat. The dotted gray line shows levels of serum creatinine in the rats infused with rhEPO. (C): There were no differences in hemoglobin levels among vehicle, hPKC, and hPKC(F+) groups at 12 weeks after cell delivery. However, rhEPO significantly increased hemoglobin levels at 12 weeks from the beginning of the treatment. (D): Urinary albumin is expressed as μg/day; ∗, p < .05 versus vehicle; #, p < .05 versus hPKC; n = 4 in each group. (E): Urinary KIM-1 is expressed as ng/day; ∗, p < .05 versus vehicle; n = 4–6. Abbreviations: GM, gentamicin; IR, ischemia-reperfusion; hPKC, human primary kidney cell; hPKC(F+), human primary kidney cell containing erythropoietin-positive cells; KIM-1, kidney injury molecule 1; rhEPO, recombinant human erythropoietin-α.
Figure 4.
Figure 4.
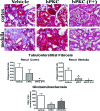
Collagen deposition in the kidneys of the ischemia-reperfusion-gentamicin (IR-GM) rats at 12 weeks following treatment. Total collagen deposition was determined by Masson's trichrome staining and is visible as a light blue color localized to the tubulointerstitial and perivascular areas of the renal cortex and medulla of IR-GM rats (top panel). Magnification, ×400. The lower panel shows the analysis of the total collagen deposition and glomerulosclerosis in the kidney. The data are expressed as collagen-to-field ratios; ∗, p < .05 versus vehicle group; n = 3–4. Abbreviations: hPKC, human primary kidney cell; hPKC(F+), human primary kidney cell containing erythropoietin-positive cells.
Figure 5.
Figure 5.
The abundance of inflammatory cells (CD68-positive) in the renal cortex and medulla of the ischemia-reperfusion-gentamicin rats. The CD68-positive cells are localized predominantly in the tubulointerstitial space of the kidney. The number of positively stained cells per ×200 area was counted using automated cell counting software (Image-Pro 6.3; Media Cybernetics). The data are the means ± SE; ∗, p < .05 versus vehicle; n = 4 per group. Magnification, ×200. Abbreviations: hPKC, human primary kidney cell; hPKC(F+), human primary kidney cell containing erythropoietin-positive cells.
Figure 6.
Figure 6.
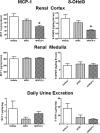
The levels of MCP-1 and 8-OHdG proteins in the renal cortical and medullary tissues as well as in the urine of the ischemia-reperfusion-gentamicin rats. In the left panels, MCP-1 expression was measured in renal cortical and medullary 20,000g supernatants and in the urine by enzyme-linked immunosorbent assay (ELISA). The data are the means ± SE; ∗, p < .05 versus vehicle; n = 4. In the right panel, 8-OHdG levels were measured in renal cortical and medullary 20,000g supernatants and in the urine by ELISA. The data are the means ± SE; ∗, p < .05 versus vehicle; n = 4. Abbreviations: hPKC, human primary kidney cell; hPKC(F+), human primary kidney cell containing erythropoietin-positive cells; MCP-1, monocyte chemotactic protein 1; 8-OHdG, 8-hydroxy-deoxyguanosine.
Figure 7.
Figure 7.
Immunostaining of the kidney tissues of ischemia-reperfusion-gentamicin rats with human nuclear antibody 12 weeks following cell transplantation. Very few stained cells were found in the kidney. The cells that were found were mostly located in the interstitial areas of the cortex. Magnification, ×630.

Similar articles

Cited by

References

    1. Al-Awqati Q, Oliver JA. Stem cells in the kidney. Kidney Int. 2002;61:387–395. - PubMed
    1. Benigni A, Morigi M, Remuzzi G. Kidney regeneration. Lancet. 2010;375:1310–1317. - PubMed
    1. Guo JK, Cantley LG. Cellular maintenance and repair of the kidney. Annu Rev Physiol. 2010;72:357–376. - PubMed
    1. U.S. Renal Data System. Minneapolis, MN: U.S. Renal Data System Coordinating Center; 2009. U.S. Renal Data System Annual Report.
    1. Zenovich AG, Taylor DA. Cell therapy in kidney disease: Cautious optimism … but optimism nonetheless. Perit Dial Int. 2007;27(suppl 2):S94–S103. - PubMed

Publication types

MeSH terms