A common rule for decision making in animal collectives across species
- PMID: 23197836
- PMCID: PMC3528575
- DOI: 10.1073/pnas.1210664109
A common rule for decision making in animal collectives across species
Erratum in
- Proc Natl Acad Sci U S A. 2013 Feb 26;110(9):3651
Abstract
A diversity of decision-making systems has been observed in animal collectives. In some species, choices depend on the differences of the numbers of animals that have chosen each of the available options, whereas in other species on the relative differences (a behavior known as Weber's law), or follow more complex rules. We here show that this diversity of decision systems corresponds to a single rule of decision making in collectives. We first obtained a decision rule based on Bayesian estimation that uses the information provided by the behaviors of the other individuals to improve the estimation of the structure of the world. We then tested this rule in decision experiments using zebrafish (Danio rerio), and in existing rich datasets of argentine ants (Linepithema humile) and sticklebacks (Gasterosteus aculeatus), showing that a unified model across species can quantitatively explain the diversity of decision systems. Further, these results show that the different counting systems used by animals, including humans, can emerge from the common principle of using social information to make good decisions.
Conflict of interest statement
The authors declare no conflict of interest.
Figures

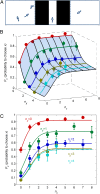
 . The rate of change of Px in the transition regions depends on the reliability parameter s, with the width of these regions proportional to
  . (C) Same as B but for three different values of parameter k: k = 0 (Left), 0 < k < 1 (Center), and k = 1 (Right).

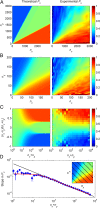
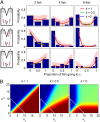
 and
and  . (D) Slope of the probability of choosing x in A as obtained from a linear fit along the lines depicted in Inset. Experimental values (blue dots; error bars are 95% confidence interval), theory (red line), and Weber’s law (black line).
Similar articles
-
Collective animal behavior from Bayesian estimation and probability matching.PLoS Comput Biol. 2011 Nov;7(11):e1002282. doi: 10.1371/journal.pcbi.1002282. Epub 2011 Nov 17. PLoS Comput Biol. 2011. PMID: 22125487 Free PMC article.
-
Modeling shortest path selection of the ant Linepithema humile using psychophysical theory and realistic parameter values.J Theor Biol. 2015 May 7;372:168-78. doi: 10.1016/j.jtbi.2015.02.030. Epub 2015 Mar 11. J Theor Biol. 2015. PMID: 25769943
-
Individual rules for trail pattern formation in Argentine ants (Linepithema humile).PLoS Comput Biol. 2012;8(7):e1002592. doi: 10.1371/journal.pcbi.1002592. Epub 2012 Jul 19. PLoS Comput Biol. 2012. PMID: 22829756 Free PMC article.
-
Complexity of environment and parsimony of decision rules in insect societies.Biol Bull. 2002 Jun;202(3):268-74. doi: 10.2307/1543478. Biol Bull. 2002. PMID: 12086999 Review.
-
Computational mate choice: theory and empirical evidence.Behav Processes. 2012 Jun;90(2):261-77. doi: 10.1016/j.beproc.2012.02.010. Epub 2012 Mar 5. Behav Processes. 2012. PMID: 22410366 Review.
Cited by
-
A Bayesian Approach to Social Structure Uncovers Cryptic Regulation of Group Dynamics in Drosophila melanogaster.Am Nat. 2015 Jun;185(6):797-808. doi: 10.1086/681084. Epub 2015 Apr 16. Am Nat. 2015. PMID: 25996864 Free PMC article.
-
Quantity as a Fish Views It: Behavior and Neurobiology.Front Neuroanat. 2022 Jul 14;16:943504. doi: 10.3389/fnana.2022.943504. eCollection 2022. Front Neuroanat. 2022. PMID: 35911657 Free PMC article. Review.
-
The entropic basis of collective behaviour.J R Soc Interface. 2015 May 6;12(106):20150037. doi: 10.1098/rsif.2015.0037. J R Soc Interface. 2015. PMID: 25833243 Free PMC article.
-
Compromise or choose: shared movement decisions in wild vulturine guineafowl.Commun Biol. 2024 Jan 13;7(1):95. doi: 10.1038/s42003-024-05782-w. Commun Biol. 2024. PMID: 38218910 Free PMC article.
-
Real-Time Localization of Moving Dipole Sources for Tracking Multiple Free-Swimming Weakly Electric Fish.PLoS One. 2013 Jun 21;8(6):e66596. doi: 10.1371/journal.pone.0066596. Print 2013. PLoS One. 2013. PMID: 23805244 Free PMC article.
References
-
- Knill DC, Pouget A. The Bayesian brain: The role of uncertainty in neural coding and computation. Trends Neurosci. 2004;27(12):712–719. - PubMed
-
- Gold JI, Shadlen MN. The neural basis of decision making. Annu Rev Neurosci. 2007;30:535–574. - PubMed
-
- Tenenbaum JB, Kemp C, Griffiths TL, Goodman ND. How to grow a mind: Statistics, structure, and abstraction. Science. 2011;331(6022):1279–1285. - PubMed
-
- Biernaskie JM, Walker SC, Gegear RJ. Bumblebees learn to forage like Bayesians. Am Nat. 2009;174(3):413–423. - PubMed
-
- McNamara JM, Green RF, Olsson O. Bayes theorem and its applications in animal behaviour. Oikos. 2006;112(2):243–251.
Publication types
MeSH terms
LinkOut - more resources
Full Text Sources

