. 2012 Dec 26;134(51):20812-9.
doi: 10.1021/ja310382d. Epub 2012 Dec 14.

Concentration-driven growth of model protocell membranes

Affiliations
Free PMC article

Concentration-driven growth of model protocell membranes

Itay Budin et al. J Am Chem Soc. .
Free PMC article

Abstract

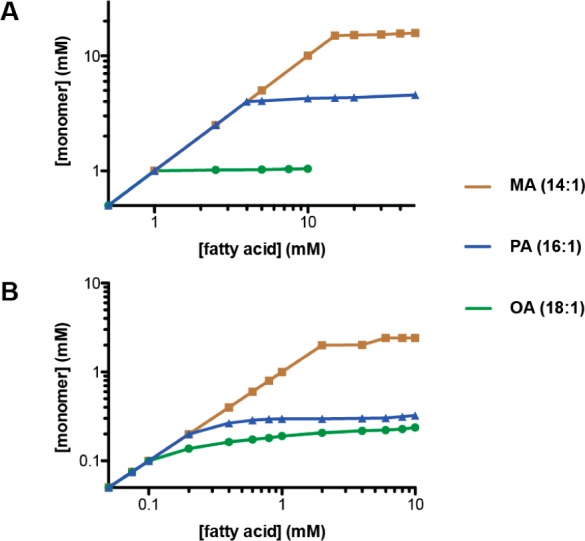
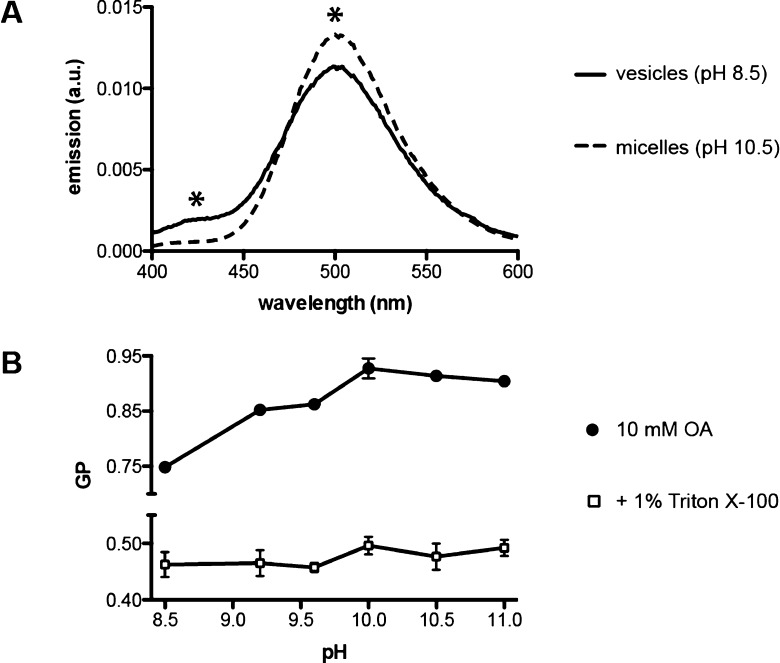
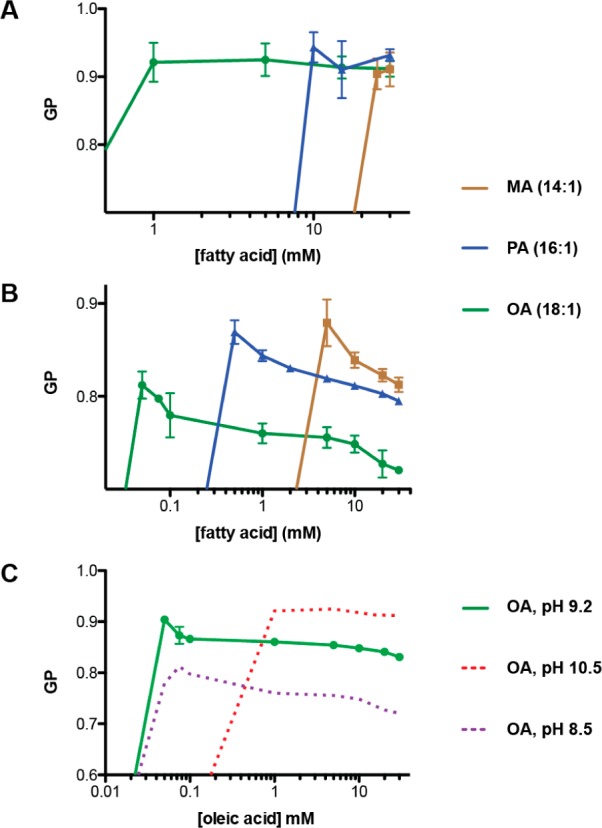
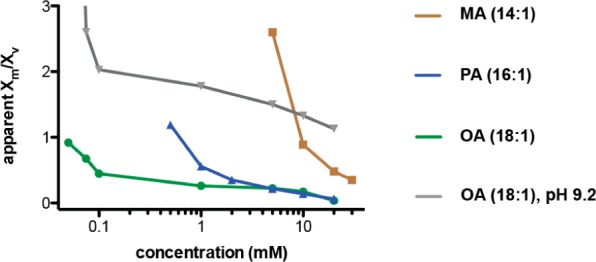
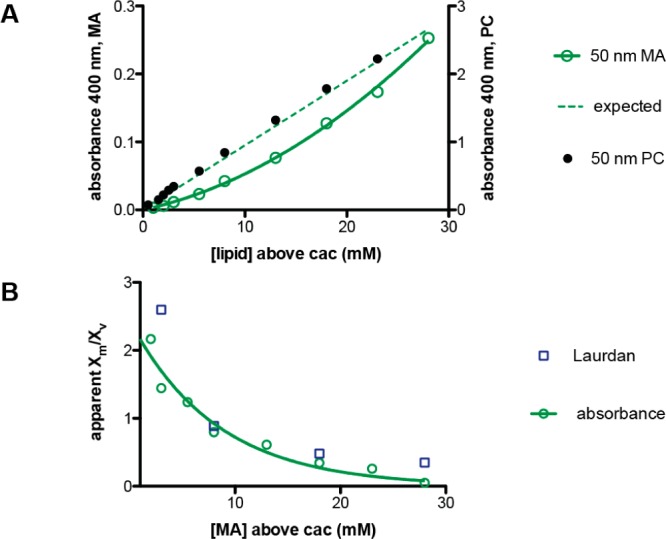
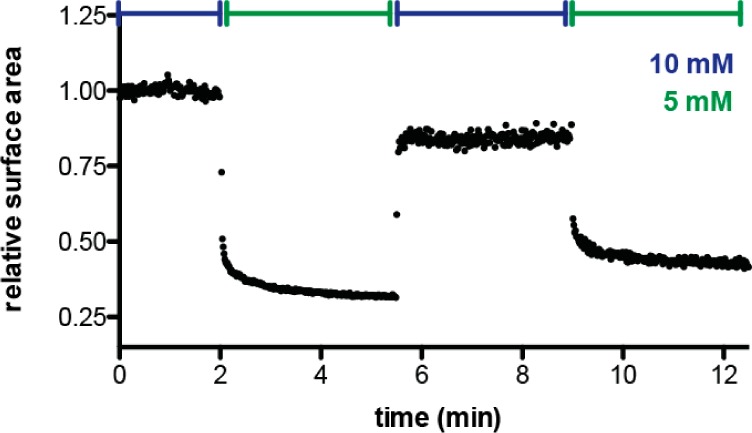
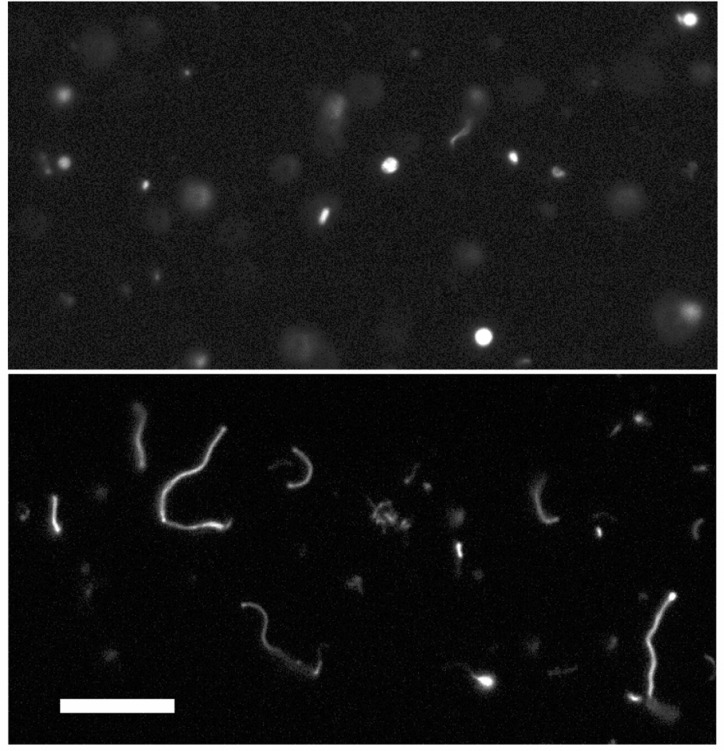
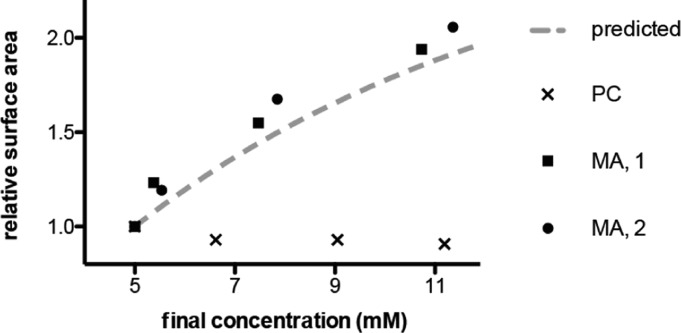
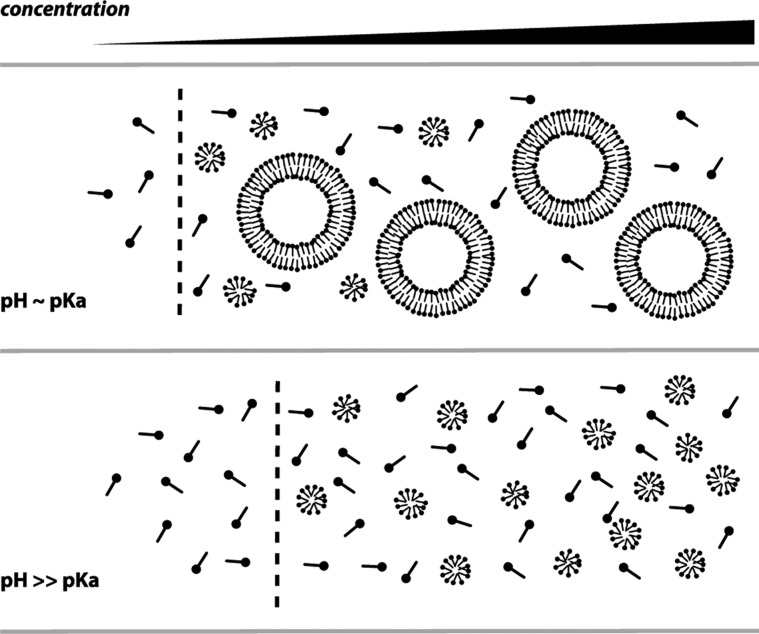
The first protocell membranes may have assembled from fatty acids and related single-chain lipids available in the prebiotic environment. Prior to the evolution of complex cellular machinery, spontaneous protocell membrane growth and division had to result from the intrinsic physicochemical properties of these molecules, in the context of specific environmental conditions. Depending on the nature of the chemical and physical environment, fatty acids can partition between several different phases, including soluble monomers, micelles, and lamellar vesicles. Here we address the concentration dependence of fatty acid aggregation, which is dominated by entropic considerations. We quantitatively distinguish between fatty acid phases using a combination of physical and spectroscopic techniques, including the use of the fluorescent fatty acid analogue Laurdan, whose emission spectrum is sensitive to structural differences between micellar and lamellar aggregates. We find that the monomer-aggregate transition largely follows a characteristic pseudophase model of molecular aggregation but that the composition of the aggregate phase is also concentration dependent. At low amphiphile concentrations above the critical aggregate concentration, vesicles coexist with a significant proportion of micelles, while more concentrated solutions favor the lamellar vesicle phase. We subsequently show that the micelle-vesicle equilibrium can be used to drive the growth of pre-existing vesicles upon an increase in amphiphile concentration either through solvent evaporation or following the addition of excess lipids. We propose a simple model for a primitive environmentally driven cell cycle, in which protocell membrane growth results from evaporative concentration, followed by shear force or photochemically induced division.


Figures

Figure 1
Figure 1
Fatty acid monomer concentrations as a function of total concentration for a series of monounsaturated fatty acids at pH 10.5 (A) and 8.5 (B). Monomer concentrations were derived from surface tension plots since aggregates are not surface active. The plateau points in (A) correspond to critical micelle concentrations (MA, 15 mM; PA, 4 mM; OA, 1 mM, in agreement with previous measurements). Plateau points in (B) indicate critical aggregation concentrations (MA, 2 mM; PA, 0.2 mM; OA, <0.1 mM). MA, myristoleate (C14:1); PA, palmitoleate (C16:1); OA, oleate (C18:1).
Figure 2
Figure 2
Aggregate dependence of Laurdan emission. (A) Emission spectrum for 25 μM Laurdan (excitation 364 nm) in 10 mM oleate at pH 8.5 (vesicles) or pH 10.5 (micelles). Asterisks indicate peaks whose emission intensities are used to calculate GP. (B) Dependence of Laurdan GP on pH in 10 mM oleate with (open squares) or without (closed circles) 1% v/v Triton X100, which disrupts fatty acid aggregates. Error bars indicate SD (n = 3).
Figure 3
Figure 3
Concentration dependence of Laurdan GP in fatty acid solutions at varying pH. (A) GP as a function of concentration for monounsaturated fatty acids at pH 10.5. GP is constant for concentrations above the cmc. (B) GP as a function of concentration for monounsaturated fatty acids at pH 8.5. GP drops monotonically once above the cac, reflecting a change in the aggregate composition. (C) GP as a function of concentration in oleate at pH 9.2. Dotted lines representing equivalent curves for pH 10.5 (from A) and 8.5 (from B) are provided for reference. Error bars indicate SD (n = 3).
Figure 4
Figure 4
Apparent micelle to vesicle partition coefficients derived from Laurdan GP data. Partition coefficients are calculated by equating measured emission intensities to weighted averages between reference vesicle and micelle solutions. Partition coefficients are given as a function of concentration in vesicle solutions at pH 8.5 or 9.2 and show that low concentration solutions are enriched in micellar aggregates.
Figure 5
Figure 5
Vesicle concentration vs myristoleate concentration. (A) Turbidity of myristoleate solutions at pH 8.5 extruded to 50 nm (green, left axis). Dashed line is the expected absorbance if the vesicle concentration scaled linearly with myristoleate concentration, relative to the absorbance at 50 mM. In contrast, the turbidity of 50 nm phospholipid (dimyristoleoyl phosphocholine, PC) vesicles scales linearly with concentration (black, right axis). Myristoleate concentrations are total solution concentrations above the myristoleate cac, 2 mM. (B) Apparent micelle to vesicle partition coefficients for myristoleate at pH 8.5 as derived from absorbance readings (green circles) and from Laurdan GP (blue squares). A fitted single exponential decay (k = 0.12 mM–1) is shown and used to predict growth in Figure 8.
Figure 6
Figure 6
Reversible vesicle growth driven by amphiphile concentration changes. Myristoleate vesicles, initially at 10 mM, shrink in surface area upon dilution to 5 mM. Surface area grows back to near the initial value upon concentration via the addition of preformed vesicles and subsequently shrinks upon further dilution. Changes in membrane area are tracked by FRET between donor and acceptor phospholipids, which remain in the vesicles due to their insolubility.
Figure 7
Figure 7
Growth of large vesicles by increase in amphiphile concentration. Multilamellar (∼4 μm) myristoleate vesicles, initially mostly spherical (top), grow into long, filamentous vesicles upon addition of concentrated preformed vesicles (bottom). Filamentous growth occurs because of the osmotically limited increase in vesicle volume and is similar to growth seen upon addition of alkaline micelles. Top image taken immediately after mixing, bottom taken 20 min later. Scale bar, 30 μm.
Figure 8
Figure 8
Solution evaporation drives the growth of fatty acid vesicles. Myristoleate (MA) vesicles, initially at 5 mM lipid concentration, were concentrated by gentle evaporation (Materials and Methods) and changes in surface area monitored by FRET at time points of 3, 10, and 24 h. Data are shown for two independent experiments (solid circles, squares) and are in agreement with that predicted from measured apparent micelle–vesicle partition coefficients (dashed line). An identical experiment with dimyristoleoyl phosphocholine (PC) vesicles did not show growth (points labeled x).
Figure 9
Figure 9
Model for fatty acid phase behavior. Solutions feature a pseudophase separation from monomers to aggregates, characterized by a cac (dashed line) that is dependent on pH. In addition, vesicle solutions feature a concentration-dependent vesicle–micelle equilibrium, with higher concentrations favoring the larger vesicle aggregates. In contrast, alkaline solutions exhibit a single sharp pseudophase transition at the cmc. Both pH and concentration-driven phase transitions can drive fatty acid vesicle growth.

References

    1. Gebicki J. M.; Hicks M. Nature 1973, 243, 232–234. - PubMed
    1. Hargreaves W. R.; Deamer D. W. Biochemistry 1978, 17, 3759–3768. - PubMed
    1. Rushdi A. I.; Simoneit B. R. Origins Life Evol. Biospheres 2001, 31, 103–118. - PubMed
    1. Simoneit B. R. T. Adv. Space Res. 2004, 33, 88–94.
    1. Yuen G. U.; Kvenvolden K. A. Nature 1973, 246, 301–303.

Publication types