. 2012 Dec 1:5:57.
doi: 10.1186/1755-8794-5-57.

Noninvasive Fetal Trisomy (NIFTY) test: an advanced noninvasive prenatal diagnosis methodology for fetal autosomal and sex chromosomal aneuploidies

Affiliations

Noninvasive Fetal Trisomy (NIFTY) test: an advanced noninvasive prenatal diagnosis methodology for fetal autosomal and sex chromosomal aneuploidies

Fuman Jiang et al. BMC Med Genomics. .

Abstract

Background: Conventional prenatal screening tests, such as maternal serum tests and ultrasound scan, have limited resolution and accuracy.

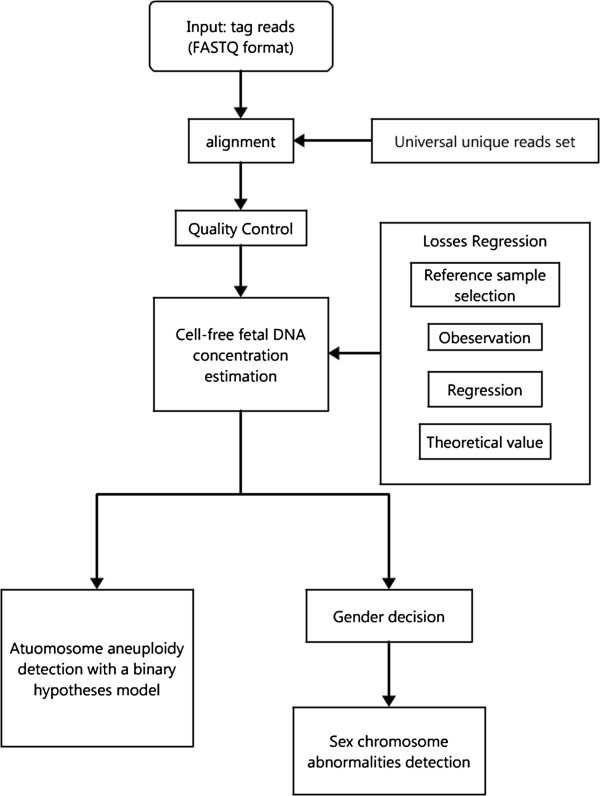
Methods: We developed an advanced noninvasive prenatal diagnosis method based on massively parallel sequencing. The Noninvasive Fetal Trisomy (NIFTY) test, combines an optimized Student's t-test with a locally weighted polynomial regression and binary hypotheses. We applied the NIFTY test to 903 pregnancies and compared the diagnostic results with those of full karyotyping.

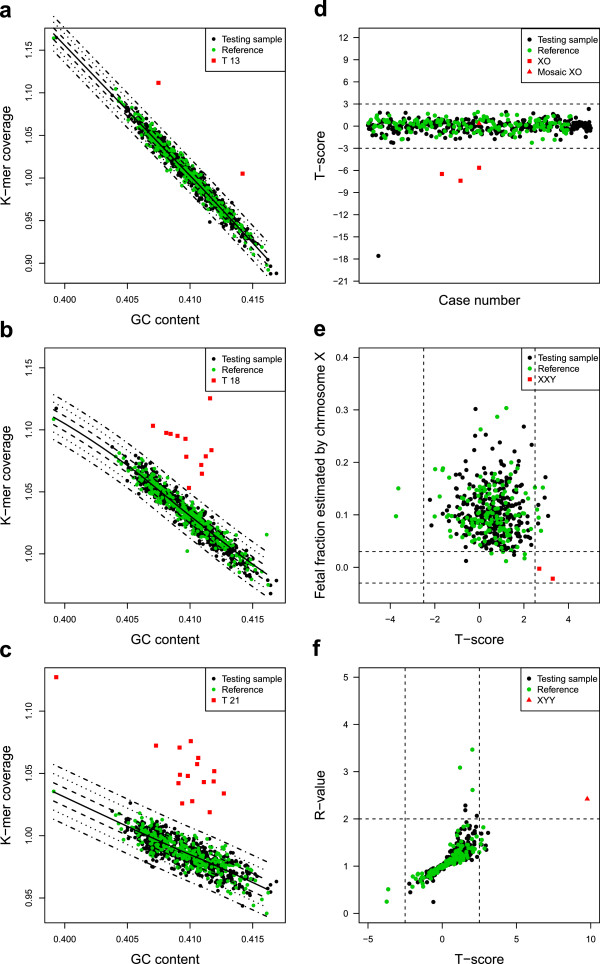
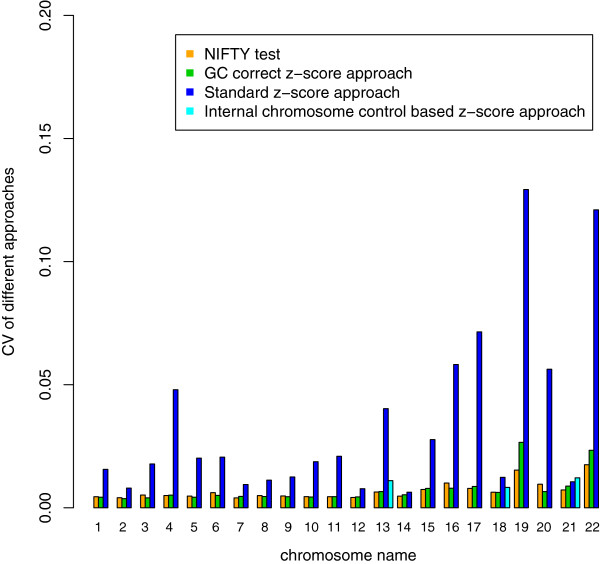
Results: 16 of 16 trisomy 21, 12 of 12 trisomy 18, two of two trisomy 13, three of four 45, X, one of one XYY and two of two XXY abnormalities were correctly identified. But one false positive case of trisomy 18 and one false negative case of 45, X were observed. The test performed with 100% sensitivity and 99.9% specificity for autosomal aneuploidies and 85.7% sensitivity and 99.9% specificity for sex chromosomal aneuploidies. Compared with three previously reported z-score approaches with/without GC-bias removal and with internal control, the NIFTY test was more accurate and robust for the detection of both autosomal and sex chromosomal aneuploidies in fetuses.

Conclusion: Our study demonstrates a powerful and reliable methodology for noninvasive prenatal diagnosis.


Figures

Figure 1
Figure 1
The flowchart of the whole bioinformatics pipeline. A comprehensive bioinformatics pipeline, including effective short read alignment, quality control, data correction, cell-free fetal DNA concentration estimation, and aneuploidy detection.
Figure 2
Figure 2
The required number of of unique reads for high sensitivity across different cff-DNA concentrations. For aneuploidy detection, the required number of unique reads (y-axis) increased with decreasing cff-DNA concentration (x-axis). For a 3.5% cff-DNA concentration, 1.7 million unique reads are needed to obtain high sensitivity.
Figure 3
Figure 3
Fetal aneuploidy detection using NIFTY test. a-c, The k-mer coverage (y-axis) of 903 samples was plotted with corresponding GC content (x-axis) for chromosome 13,18 and 21. The solid black line is the fit between the k-mer coverage and GC content among the 300 controls. The dot-dash lines from inside to outside are the contour lines of t=1, t=2 and t=3 respectively. d, XO detection. The t-score of chromosome X for 452 cases with female fetuses and 4 XO cases is dotted. The t-score less than −2.5 indicates XO aneuploidy. e, XXY detection. The x-axis is the t-score of chromosome X for samples carrying male fetuses. The y-axis is the fetal fraction estimated by chromosome X. Red square points indicated XXY cases that have a t-score larger than 2.5 and the cff-DNA concentration estimated by chromosome X nearly equal to zero. f, XYY detection. The x-axis is t-score for chromosome X among samples carrying male fetuses. The y-axis is the R-value, i.e. the ratio of the fetal DNA fraction estimated by chromosome Y to that estimated by chromosome X. Red triangle points indicate XYY cases with t-score greater than 2.5 and R-value greater than 2. The case types are color coded (black: testing samples; green: reference samples; red: aneuploidy samples).
Figure 4
Figure 4
The Performance of three methods: coefficient of variation (CV). We calculated the CVs (y-axis) among the different chromosomes (x-axis) for the 903 samples with karyotyping. The different methods are the color-coded (Orange: NIFTY test; Green: GC correct z-score approach; Dark Blue: Standard z-score approach; Light Blue: Internal chromosome control based z-score approach). In the clinically interesting chromosomes (13, 18, 21), our approach obtained the lowest CVs, indicating a higher sensitivity.

References

    1. Driscoll DA, Gross S. Clinical practice. Prenatal screening for aneuploidy. N Engl J Med. 2009;360(24):2556–2562. doi: 10.1056/NEJMcp0900134. - DOI - PubMed
    1. Bouchlariotou S, Tsikouras P, Dimitraki M, Athanasiadis A, Papoulidis I, Maroulis G, Liberis A, Liberis V. Turner’s syndrome and pregnancy: has the 45, X/47, XXX mosaicism a different prognosis? Own clinical experience and literature review. J Matern Fetal Neonatal Med. 2011;24(5):668–672. doi: 10.3109/14767058.2010.520769. - DOI - PubMed
    1. Leggett V, Jacobs P, Nation K, Scerif G, Bishop DV. Neurocognitive outcomes of individuals with a sex chromosome trisomy: XXX, XYY, or XXY: a systematic review. Dev Med Child Neurol. 2010;52(2):119–129. doi: 10.1111/j.1469-8749.2009.03545.x. - DOI - PMC - PubMed
    1. Hofherr SE, Wiktor AE, Kipp BR, Dawson DB, Van Dyke DL. Clinical diagnostic testing for the cytogenetic and molecular causes of male infertility: the Mayo Clinic experience. J Assist Reprod Genet. 2011;28(11):1091–1098. doi: 10.1007/s10815-011-9633-6. - DOI - PMC - PubMed
    1. Rives N, Simeon N, Milazzo JP, Barthelemy C, Mace B. Meiotic segregation of sex chromosomes in mosaic and non-mosaic XYY males: case reports and review of the literature. Int J Androl. 2003;26(4):242–249. doi: 10.1046/j.1365-2605.2003.00421.x. - DOI - PubMed

Publication types