. 2012 Dec 3;3(1):27.
doi: 10.1186/2041-9139-3-27.

Whole-body gene expression pattern registration in Platynereis larvae

Affiliations

Whole-body gene expression pattern registration in Platynereis larvae

Albina Asadulina et al. Evodevo. .

Abstract

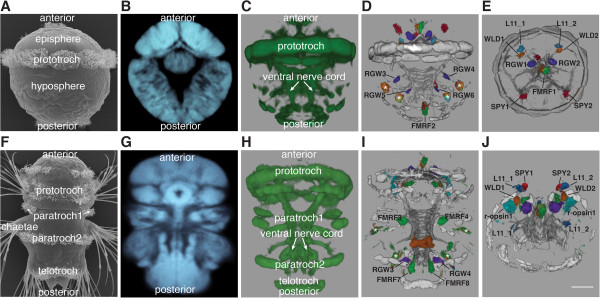
Background: Digital anatomical atlases are increasingly used in order to depict different gene expression patterns and neuronal morphologies within a standardized reference template. In evo-devo, a discipline in which the comparison of gene expression patterns is a widely used approach, such standardized anatomical atlases would allow a more rigorous assessment of the conservation of and changes in gene expression patterns during micro- and macroevolutionary time scales. Due to its small size and invariant early development, the annelid Platynereis dumerilii is particularly well suited for such studies. Recently a reference template with registered gene expression patterns has been generated for the anterior part (episphere) of the Platynereis trochophore larva and used for the detailed study of neuronal development.

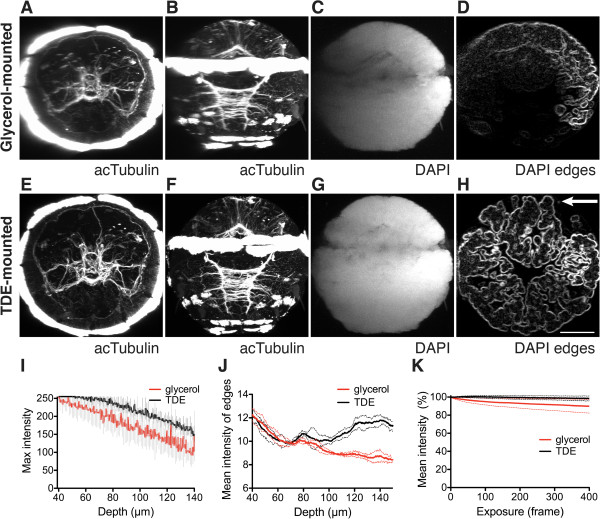
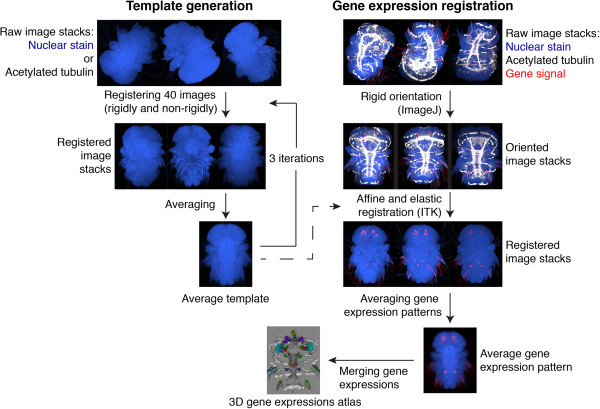
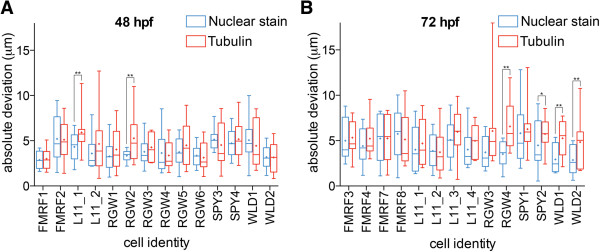
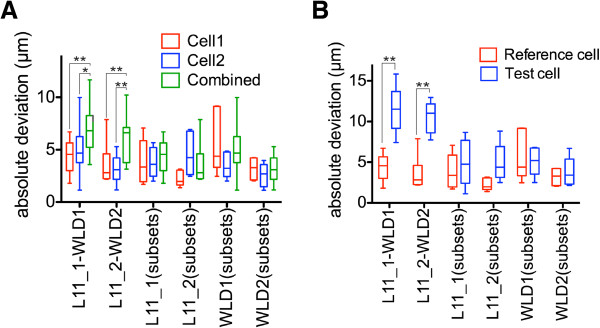
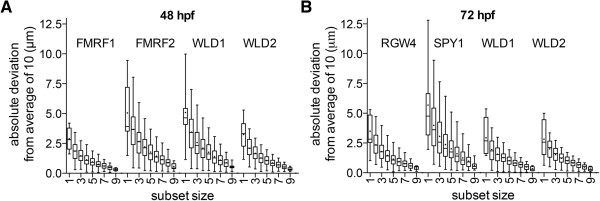
Results: Here we introduce and evaluate a method for whole-body gene expression pattern registration for Platynereis trochophore and nectochaete larvae based on whole-mount in situ hybridization, confocal microscopy, and image registration. We achieved high-resolution whole-body scanning using the mounting medium 2,2'-thiodiethanol (TDE), which allows the matching of the refractive index of the sample to that of glass and immersion oil thereby reducing spherical aberration and improving depth penetration. This approach allowed us to scan entire whole-mount larvae stained with nitroblue tetrazolium/5-bromo-4-chloro-3-indolyl phosphate (NBT/BCIP) in situ hybridization and counterstained fluorescently with an acetylated-tubulin antibody and the nuclear stain 4'6-diamidino-2-phenylindole (DAPI). Due to the submicron isotropic voxel size whole-mount larvae could be scanned in any orientation. Based on the whole-body scans, we generated four different reference templates by the iterative registration and averaging of 40 individual image stacks using either the acetylated-tubulin or the nuclear-stain signal for each developmental stage. We then registered to these templates the expression patterns of cell-type specific genes. In order to evaluate the gene expression pattern registration, we analyzed the absolute deviation of cell-center positions. Both the acetylated-tubulin- and the nuclear-stain-based templates allowed near-cellular-resolution gene expression registration. Nuclear-stain-based templates often performed significantly better than acetylated-tubulin-based templates. We provide detailed guidelines and scripts for the use and further expansion of the Platynereis gene expression atlas.

Conclusions: We established whole-body reference templates for the generation of gene expression atlases for Platynereis trochophore and nectochaete larvae. We anticipate that nuclear-staining-based image registration will be applicable for whole-body alignment of the embryonic and larval stages of other organisms in a similar size range.


Figures

Figure 1
Figure 1
Whole-body confocal scans of Platynereis larvae mounted in glycerol or TDE. (A-D) Lateral scan of a 48 hpf larva stained for acetylated-tubulin and DAPI, mounted in glycerol. (E-H) Lateral scan of a 48 hpf larva stained for acetylated-tubulin and DAPI, mounted in TDE. (D, H) Edges detected with FeatureJ Edges are shown in an orthogonal slice of the DAPI channel. (A and E) are anterior views, (B-D, F-H) are ventral views. (I) Decay of the maximum intensity value in the DAPI channel along the depth of the image stack in glycerol and TDE. (J) Decay of the average DAPI edge signal detected with FeatureJ Edges along the depth of the image stack in glycerol and TDE. (K) Decay of DAPI signal intensity due to bleaching in one optical slice throughout exposure time in glycerol and TDE. For (I-K) mean and standard deviation are shown, n = 3 larvae. Arrow in (H) indicates the direction of scan for (A-H). Scale bar: 50 μm. hpf, hours post fertilization; DAPI, 4’,6-diamidino-2-phenylindole; TDE, 2,2’-thiodiethanol.
Figure 2
Figure 2
Schematic of whole-body template generation and gene expression registration in Platynereis. We generated each template from 40 scanned larvae stained with a reference marker (DAPI or acetylated tubulin) by iterative alignment and averaging. The templates were used to register gene expression patterns. We scanned several in situ hybridization samples (five to ten) for each gene, co-stained with the reference marker. We first rotated the images rigidly and registered them non-rigidly to the templates using the reference signal. We averaged the registered expression patterns for each gene to obtain a representative average expression pattern. These average gene expression patterns were integrated into the atlas. DAPI, 4’,6-diamidino-2-phenylindole.
Figure 3
Figure 3
Average templates with aligned gene expression patterns in 48 hpf and 72 hpf Platynereis larvae. Scanning electron microscopic image of a 48 hpf trochophore (A) and a 72 hpf nectochaete (F) Platynereis larva. Average nuclear-stain templates for 48 hpf (B) and 72 hpf (G) larvae and tubulin templates for 48 hpf (C) and 72 hpf (H) larvae. Average gene expression patterns and acetylated tubulin were registered to the nuclear-stain templates for 48 hpf (D, E) and 72 hpf (I, J) larvae. (A-D, F-I) are ventral views, (E, J) are anterior views. The cells that were used for the quantifications are labeled. White asterisks in D and I indicate the autofluorescent spinning glands in the trunk. Scale bar: 30 μm. hpf, hours post fertilization.
Figure 4
Figure 4
Evaluation of the precision of gene expression pattern registration to the nuclear-stain and the tubulin templates. (A, B) Absolute deviation of center positions of the corresponding cells (that is, distances of the individual cells to their average coordinate) for 48 hpf (A) and 72 hpf (B) larvae for the indicated cells for the nuclear-stain and the tubulin templates. The cells and their identifiers are shown in Figure 3. The graphs represent min-max values, (+) indicates mean values. P values of a paired t-test are shown: *P <0.05, **P <0.01. hpf, hours post fertilization.
Figure 5
Figure 5
Colocalization analysis of genes expressed in single cells. (A) Comparison of absolute deviation values of cell center positions for the indicated cell pairs analyzed alone or combined together. (B) Comparison of absolute deviation values of cell center positions for a ‘reference cell’ and a ‘test cell’ relative to the ‘reference cell’ average. Coexpressed genes were simulated by splitting the images for the same gene into two subsets (a ‘reference’ and a ‘test’ set). The cells and their identifiers are shown in Figure 3. P values of an unpaired t-test are shown: *P <0.05, **P <0.01.
Figure 6
Figure 6
Experimental verification of coexpression for a gene pair showing colocalization in the atlas. (A-D) Colocalization of the average signals for r-opsin-1 (cyan) and TrpC (magenta) in a 72 hpf larva, as determined by image registration to the nuclear-stain template. (E-H) Coexpression of r-opsin-1 (cyan) and TrpC (magenta) in a 72 hpf larva, as determined by double in situ hybridization. (D, H) are close up images of the boxed areas shown in C and G. H only shows a single plane. Scale bar (A-C, E-G) 30 μm, (D, H) 10 μm. DLE, dorsal larval eye; hpf, hours post fertilization; VLE, ventral larval eye.
Figure 7
Figure 7
Effect of sample size on the absolute deviation of cell center positions. We determined the average cell body coordinates of the indicated cells from ten scans each. We sampled random subsets of one to nine (1000 each) from the complete set of each cell. The absolute deviation of cell center positions of the different subsets relative to the complete set average are shown for 48 hpf (A) and 72 hpf (B) larvae. The cells and their identifiers are shown in Figure 3. We chose the two best and the two worst registered cells for both stages. The graphs represent min-max values, (+) indicates mean values. hpf, hours post fertilization.

References

    1. Jenett A, Schindelin JE, Heisenberg M. The Virtual Insect Brain protocol: creating and comparing standardized neuroanatomy. BMC Bioinforma. 2006;7:544. doi: 10.1186/1471-2105-7-544. - DOI - PMC - PubMed
    1. Long F, Peng H, Liu X, Kim SK, Myers E. A 3D digital atlas of C. elegans and its application to single-cell analyses. Nat Methods. 2009;6:667–672. doi: 10.1038/nmeth.1366. - DOI - PMC - PubMed
    1. Jundi El B, Huetteroth W, Kurylas AE, Schachtner J. Anisometric brain dimorphism revisited: Implementation of a volumetric 3D standard brain in Manduca sexta. J Comp Neuro. 2009;517:210–225. doi: 10.1002/cne.22150. - DOI - PubMed
    1. Dreyer D, Vitt H, Dippel S, Goetz B, Jundi El B, Kollmann M, Huetteroth W, Schachtner J. 3D Standard Brain of the Red Flour Beetle Tribolium Castaneum: A Tool to Study Metamorphic Development and Adult Plasticity. Front Syst Neurosci. 2010;4:3. - PMC - PubMed
    1. Brandt R, Rohlfing T, Rybak J, Krofczik S, Maye A, Westerhoff M, Hege H-C, Menzel R. Three dimensional average-shape atlas of the honeybee brain and its applications. J Comp Neurol. 2005;492:1–19. doi: 10.1002/cne.20644. - DOI - PubMed

LinkOut - more resources