

MultiContrast Delayed Enhancement (MCODE) improves detection of subendocardial myocardial infarction by late gadolinium enhancement cardiovascular magnetic resonance: a clinical validation study
- PMID: 23199362
- PMCID: PMC3552709
- DOI: 10.1186/1532-429X-14-83
MultiContrast Delayed Enhancement (MCODE) improves detection of subendocardial myocardial infarction by late gadolinium enhancement cardiovascular magnetic resonance: a clinical validation study
Abstract
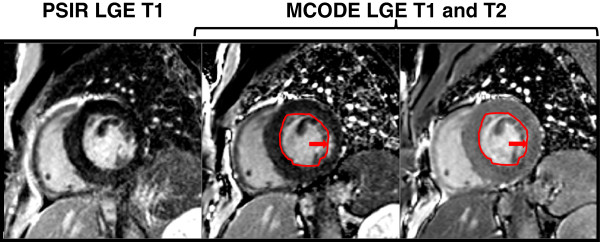
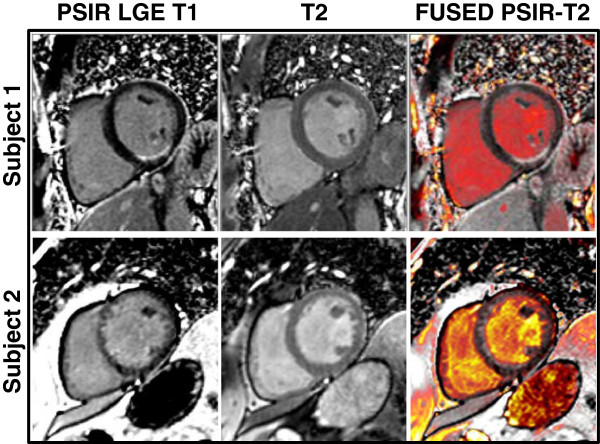
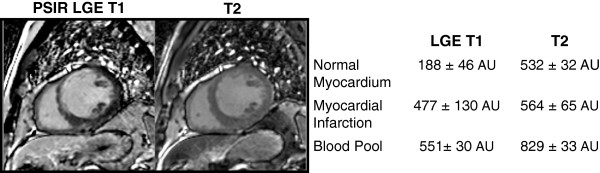
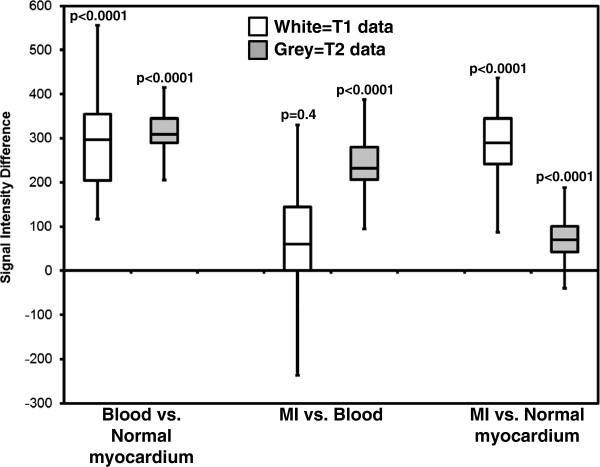
Background: Myocardial infarction (MI) documented by late gadolinium enhancement (LGE) has clinical and prognostic importance, but its detection is sometimes compromised by poor contrast between blood and MI. MultiContrast Delayed Enhancement (MCODE) is a technique that helps discriminate subendocardial MI from blood pool by simultaneously providing a T2-weighted image with a PSIR (phase sensitive inversion recovery) LGE image. In this clinical validation study, our goal was to prospectively compare standard LGE imaging to MCODE in the detection of MI.
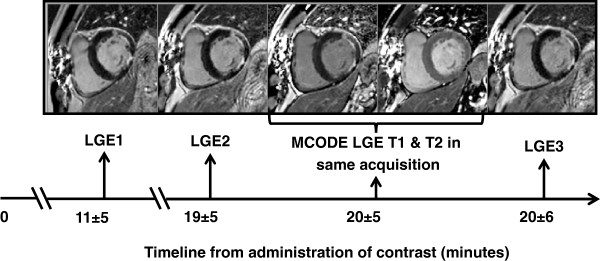
Methods: Imaging was performed on a 1.5 T scanner on patients referred for CMR including a LGE study. Prospective comparisons between MCODE and standard PSIR LGE imaging were done by targeted, repeat imaging of slice locations. Clinical data were used to determine MI status. Images at each of multiple time points were read on separate days and categorized as to whether or not MI was present and whether an infarction was transmural or subendocardial. The extent of infarction was scored on a sector-by-sector basis.
Results: Seventy-three patients were imaged with the specified protocol. The majority were referred for vasodilator perfusion exams and viability assessment (37 ischemia assessment, 12 acute MI, 10 chronic MI, 12 other diagnoses). Forty-six patients had a final diagnosis of MI (30 subendocardial and 16 transmural). MCODE had similar specificity compared to LGE at all time points but demonstrated better sensitivity compared to LGE performed early and immediately before and after the MCODE (p = 0.008 and 0.02 respectively). Conventional LGE only missed cases of subendocardial MI. Both LGE and MCODE identified all transmural MI. Based on clinical determination of MI, MCODE had three false positive MI's; LGE had two false positive MI's including two of the three MCODE false positives. On a per sector basis, MCODE identified more infarcted sectors compared to LGE performed immediately prior to MCODE (p < 0.001).
Conclusion: While both PSIR LGE and MCODE were good in identifying MI, MCODE demonstrated more subendocardial MI's than LGE and identified a larger number of infarcted sectors. The simultaneous acquisition of T1 and T2-weighted images improved differentiation of blood pool from enhanced subendocardial MI.
Figures


References
-
- Kwon DH, Halley CM, Carrigan TP, Zysek V, Popovic ZB, Setser R, Schoenhagen P, Starling RC, Flamm SD, Desai MY. Extent of left ventricular scar predicts outcomes in ischemic cardiomyopathy patients with significantly reduced systolic function: a delayed hyperenhancement cardiac magnetic resonance study. JACC Cardiovasc Imaging. 2009;2:34–44. doi: 10.1016/j.jcmg.2008.09.010. - DOI - PubMed
-
- Kwong RY, Chan AK, Brown KA, Chan CW, Reynolds HG, Tsang S, Davis RB. Impact of unrecognized myocardial scar detected by cardiac magnetic resonance imaging on event-free survival in patients presenting with signs or symptoms of coronary artery disease. Circulation. 2006;113:2733–2743. doi: 10.1161/CIRCULATIONAHA.105.570648. - DOI - PubMed
-
- Adabag AS, Maron BJ, Appelbaum E, Harrigan CJ, Buros JL, Gibson CM, Lesser JR, Hanna CA, Udelson JE, Manning WJ, Maron MS. Occurrence and frequency of arrhythmias in hypertrophic cardiomyopathy in relation to delayed enhancement on cardiovascular magnetic resonance. J Am Coll Cardiol. 2008;51:1369–1374. doi: 10.1016/j.jacc.2007.11.071. - DOI - PubMed
-
- Kwon DH, Smedira NG, Rodriguez ER, Tan C, Setser R, Thamilarasan M, Lytle BW, Lever HM, Desai MY. Cardiac magnetic resonance detection of myocardial scarring in hypertrophic cardiomyopathy: correlation with histopathology and prevalence of ventricular tachycardia. J Am Coll Cardiol. 2009;54:242–249. doi: 10.1016/j.jacc.2009.04.026. - DOI - PubMed
Publication types
MeSH terms
Substances
Grants and funding
LinkOut - more resources
Full Text Sources
Other Literature Sources
Medical
