. 2012 Nov 7;103(9):1919-28.
doi: 10.1016/j.bpj.2012.09.022.

Force spectroscopy with dual-trap optical tweezers: molecular stiffness measurements and coupled fluctuations analysis

Affiliations

Force spectroscopy with dual-trap optical tweezers: molecular stiffness measurements and coupled fluctuations analysis

M Ribezzi-Crivellari et al. Biophys J. .

Abstract

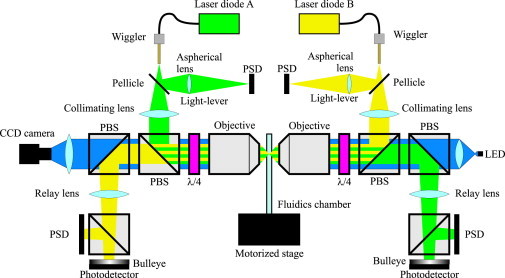
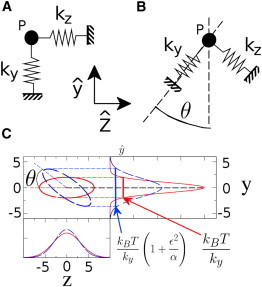
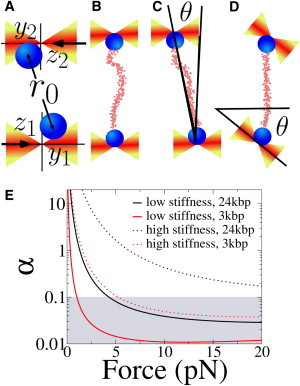
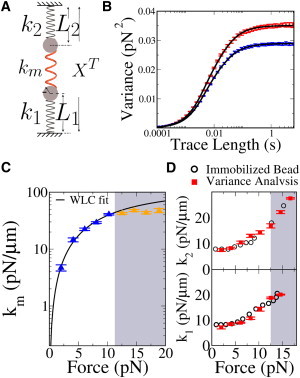
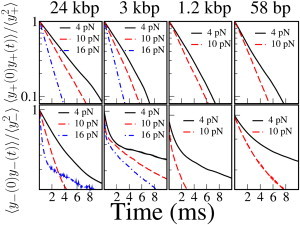
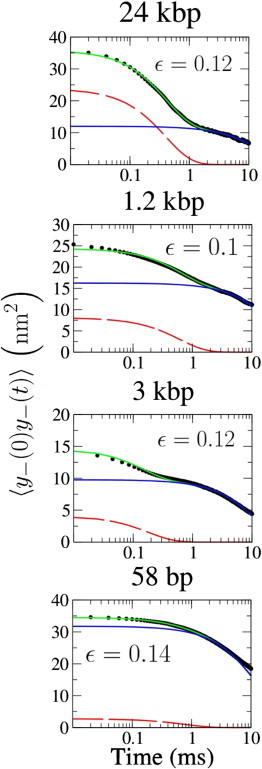
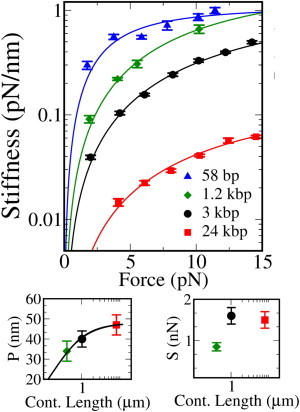
Dual-trap optical tweezers are often used in high-resolution measurements in single-molecule biophysics. Such measurements can be hindered by the presence of extraneous noise sources, the most prominent of which is the coupling of fluctuations along different spatial directions, which may affect any optical tweezers setup. In this article, we analyze, both from the theoretical and the experimental points of view, the most common source for these couplings in dual-trap optical-tweezers setups: the misalignment of traps and tether. We give criteria to distinguish different kinds of misalignment, to estimate their quantitative relevance and to include them in the data analysis. The experimental data is obtained in a, to our knowledge, novel dual-trap optical-tweezers setup that directly measures forces. In the case in which misalignment is negligible, we provide a method to measure the stiffness of traps and tether based on variance analysis. This method can be seen as a calibration technique valid beyond the linear trap region. Our analysis is then employed to measure the persistence length of dsDNA tethers of three different lengths spanning two orders of magnitude. The effective persistence length of such tethers is shown to decrease with the contour length, in accordance with previous studies.


Figures

Figure 1
Figure 1
Experimental setup. The scheme of the optical setup, with the optical paths of the lasers and the LED. Fiber-coupled diode lasers are focused inside a fluidics chamber to form optical traps using underfilling beams in high NA objectives. All the light leaving from the trap is collected by a second objective, and sent to a position-sensitive detector that integrates the light momentum flux, measuring changes in light momentum (2). The laser beams share part of their optical paths and are separated by polarization. Part of the laser light (≃ 5%) is deviated by a pellicle before focusing and used to monitor the trap position (light lever). Each trap is moved by pushing the tip of the optical fiber by piezos coupled to a brass tube (wigglers).
Figure 2
Figure 2
Coupled fluctuations in a plane. (A) A particle (P) is constrained by two springs that are oriented along the y,z coordinate axes (shown by the two arrows). The values ky,kz denote the spring stiffnesses along y,z. (B) A particle (P) constrained by two springs that are misaligned by an angle θ with respect to the coordinate axes. (C) Level curves and marginal distributions for the joint equilibrium probability distribution of the particle position in the two systems shown in panels A (solid curves) and B (dashed curves). If the two springs have very different stiffnesses, the level curves form highly eccentric ellipses. In this situation a rotation by a small angle θ in the joint distribution can lead to a large change in the marginal distribution for y. The large difference in stiffness acts as a lever arm amplifying the strength of the coupling.
Figure 3
Figure 3
Misaligned experimental configurations. (A) The coordinate system used throughout the text. The direction of light propagation (black horizontal arrows) defines the optical (zˆ) axis. The stretching direction, perpendicular to zˆ, defines the yˆ axis. The positions of the beads ((y1,z1) and (y2,z2)) are measured with respect to the equilibrium positions and r0 denotes the mean separation between the centers of the beads. (B) In the aligned configuration, the tether is perfectly oriented along the yˆ axis. (C) Misaligned tether, the two traps are focused at different positions along the optical axis and the tether forms an angle θ with the yˆ axis. (D) In misaligned traps, the principal axes of the traps form an angle θ with the y-z reference frame. (E) The value of α, Eq. 28, as a function of the mean force, for different tethers (3 kbp and 24 kbp dsDNA) and trap stiffnesses. (Continuous lines, i.e., low trap stiffness) Setup similar to that used for the measurements discussed in this article, with ky ≃ 0.02 pN/nm, kz ≃ 0.01 pN/nm. (Dotted line, i.e., high trap stiffness) Setup 10-times stiffer (such as that described in Gebhardt et al. (7) and Comstock et al. (8)). (Shaded area) Values of α for which a coupling ε ≃ 0.1 causes a 10% error (ε2/α ≃ 0.1).
Figure 4
Figure 4
Trap and molecular stiffness measurements. (A) A linear dumbbell model, where three elastic elements with different stiffnesses are arranged in series: Trap 1 (k1), Trap 2 (k2), and the tether (km). (B) Measured force variance as a function of trace length. The two data sets refer to the variance in each trap, measured on a 24-kbp tether and pulled at 10 pN. Force fluctuations in each trap are the superposition of two different linear modes. (Solid curves) Fits to the expected behavior in the case of a superposition of two modes (see the Supporting Material). The good agreement between theory and experiment shows that the effect of low-frequency noise is not relevant on our experimental timescales (<1%). (C) Molecular stiffness (km) measured and averaged over different molecules. (Continuous line) Fit to the extensible WLC model Eq. 44, giving a persistence length P = 52 ± 4 nm and a stretch modulus S = 1000 ± 200 pN, consistent with what it is reported in Smith et al. (19). (Shaded area) Region where misalignment is expected to be relevant. The fair points are not included in the fit and show the effect of misalignment. (D) Comparison of the stiffness values of the two traps, k1 and k2, measured through Eqs. 39–41 (solid symbols) with those measured by immobilizing the bead on the micropipette (open symbols); see Materials and Methods. Measurements agree within experimental errors. Note that stiffness is measured correctly even when misalignment is relevant (shaded region). This happens because the measurement of trap stiffness is mostly based on the center-of-mass coordinate, which is not affected in the case of tether misalignment.
Figure 5
Figure 5
Time correlation functions in dsDNA tethers of varying contour length at different forces. Time correlation functions were measured along the y axis (〈y2+(0) y+(t)〉, 〈y(0) y(t)〉) and normalized by the variances (〈y2+〉, 〈y2+〉). (Upper panels) Correlation function for fluctuations of the center of mass. The correlation function shows a simple exponential decay as expected for a single-component noise. The correlation function changes with force due to trap nonlinearity (change in trap stiffness) but does not show dependence on the length of the tether. (Lower panels) Correlation function for the distance between the centers of the beads. These correlation functions show a double-exponential behavior (Fig. 6) which denotes the presence of two relaxational processes. Data for 58 bp and 1.2 kbp DNA tethers are not shown at 16 pN as these experiments were carried out on tethers with an inserted hairpin which unfolds at ∼14 pN (4), and the released ssDNA would affect the stiffness measurement.
Figure 6
Figure 6
Fast and slow components of the correlation function of the differential coordinate. Double-exponential fits to 〈y(0), y(t)〉 in semi-log plot. (Dots) For experimental data, the continuous fair curve superimposed on the data shows a double-exponential fit to the measured data. (Dark solid curves) Fast and slow components of the double-exponential fit. Every plot reports the value of ε, the coupling strength as obtained from Eq. 42. As the molecules get shorter, the relative weight of slow fluctuations increases, indicating a stronger coupling.
Figure 7
Figure 7
Measurement of the molecular stiffness. (Main figure) Measured molecular stiffness for four tethers 58 bp (triangles), 1.2 kbp (diamonds), 3 kbp (squares), and 24 kbp (circles), as a function of the mean force along the tether. (Symbols) For measured quantities, data from at least three different molecules have been averaged in the four cases. (Solid lines) EWLC fit to the data (main text). The Marko-Siggia approximation is not valid in the case of the shortest (58 bp) molecule. In this case, the fit is only meant to compare the results obtained in the DTOT with those reported in Forns et al. (4) obtained in a STOT. The fit results are shown in Table 1. (Upper-right panel) Comparison of the measured persistence length (P) of the three longer tethers to the empirical scaling law proposed by Seol et al. (14) in Eq. 45 (solid line). Fit parameters are discussed in the main text. (Lower-right panel) Measured stretch modulus for the three longer tethers. Errors in P and S values are standard deviation over at least three different molecules.
None
None
None
None
None

References

    1. Meiners J.C., Quake S.R. FemtoNewton force spectroscopy of single extended DNA molecules. Phys. Rev. Lett. 2000;84:5014–5017. - PubMed
    1. Smith S.B., Cui Y., Bustamante C. Optical-trap force transducer that operates by direct measurement of light momentum. Methods Enzymol. 2003;361:134–162. - PubMed
    1. Huguet J.M., Bizarro C.V., Ritort F. Single-molecule derivation of salt dependent base-pair free energies in DNA. Proc. Natl. Acad. Sci. USA. 2010;107:15431–15436. - PMC - PubMed
    1. Forns N., de Lorenzo S., Ritort F. Improving signal/noise resolution in single-molecule experiments using molecular constructs with short handles. Biophys. J. 2011;100:1765–1774. - PMC - PubMed
    1. Meiners J.C., Quake S.R. Direct measurement of hydrodynamic cross correlations between two particles in an external potential. Phys. Rev. Lett. 1999;82:2211–2214.

Publication types