. 2012 Nov 21;103(10):2134-44.
doi: 10.1016/j.bpj.2012.10.002. Epub 2012 Nov 20.

Locating a lipid at the portal to the lipoxygenase active site

Affiliations

Locating a lipid at the portal to the lipoxygenase active site

Betty J Gaffney et al. Biophys J. .

Abstract

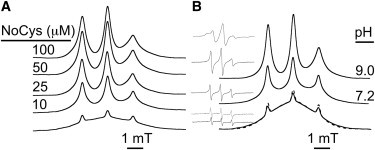
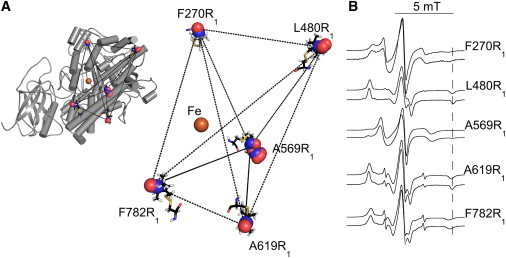
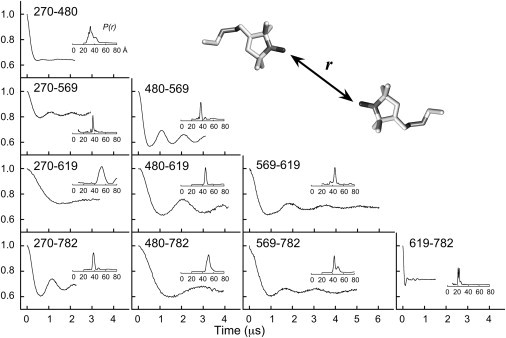
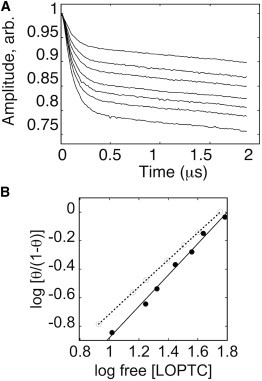
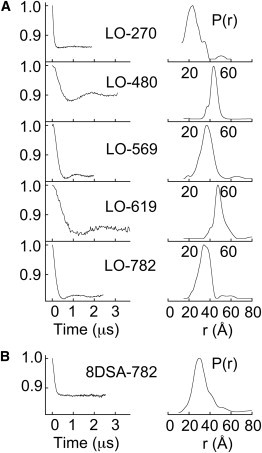
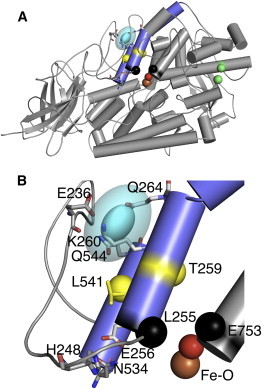
Lipoxygenase enzymes initiate diverse signaling pathways by specifically directing oxygen to different carbons of arachidonate and other polyunsaturated acyl chains, but structural origins of this specificity have remained unclear. We therefore determined the nature of the lipoxygenase interaction with the polar-end of a paramagnetic lipid by electron paramagnetic resonance spectroscopy. Distances between selected grid points on soybean seed lipoxygenase-1 (SBL1) and a lysolecithin spin-labeled on choline were measured by pulsed (electron) dipolar spectroscopy. The protein grid was designed by structure-based modeling so that five natural side chains were replaced with spin labels. Pairwise distances in 10 doubly spin-labeled mutants were examined by pulsed dipolar spectroscopy, and a fit to the model was optimized. Finally, experimental distances between the lysolecithin spin and each single spin site on SBL1 were also obtained. With these 15 distances, distance geometry localized the polar-end and the spin of the lysolecithin to the region between the two domains in the SBL1 structure, nearest to E236, K260, Q264, and Q544. Mutation of a nearby residue, E256A, relieved the high pH requirement for enzyme activity of SBL1 and allowed lipid binding at pH 7.2. This general approach could be used to locate other flexible molecules in macromolecular complexes.


Figures

Figure 1
Figure 1
Solution electron paramagnetic resonance (EPR) spectra of 1-oleoyl-2-hydroxy-sn-glycero-3-phospho(TEMPO)choline (LOPTC) bound to cysteine-free construct (NoCys) lipoxygenase. Figures are shown as first integrals to emphasize differences between pure LOPTC micelles (lower traces) and varied amounts of LOPTC bound to protein (upper). (A) Constant LOPTC (30 μM) was titrated with increasing amounts of NoCys protein (in 0.1 M TRICINE, pH 9.0, 30% sucrose). (B) The fraction of LOPTC bound to NoCys was a function of pH. Total [LOPTC] was 60 μM, and NoCys was 100 μM (0.1 M TRIS, pH 9.0 or 7.2 as indicated). Micelle spectra at both pH values are shown at the bottom in panel B; the one with slightly increased monomer signal is at pH 9.0. (Insets) Derivative EPR spectra of each sample. The temperature in panels A and B was 295 K (except for the upper inset, for which the temperature was 275 K).
Figure 2
Figure 2
Experimental strategy. (A) Placement of the spin-labeled R1 side chain, replacing natural side chains, in the structure of soybean seed lipoxygenase-1 (SBL1) (PDB:1YGE). The coordinates of spin-labeled residues F270R1, L480R1, A519R1, A619R1, and F782R1 were generated with the software PRONOX. The allowed solutions for nitroxide oxygen (red) and nitrogen (blue) are illustrated (spheres), and one full nitroxide at each site is rendered (sticks). The catalytic iron ion is indicated (orange). Representative distances (lines) between spin labels to be measured by PDS. (Left) Placement of the spin-label sites in the overall SBL1 structure. Helices that contain <5 amino acids are simplified (loops), modifying PDB:1YGE from 46 to 26 helices. (Right) The calculated spin locations are enlarged. (B) Solution EPR spectra of SBL1 spin labeled at single sites. The maximum hyperfine separations, qualitative measures of R1 side-chain vary (verticle line drawn on the right side of the figure). Samples were at pH 8.4 (0.1 M TRICINE-HCl, 22°C), without (upper) and with (lower) 30% sucrose (w/v).
Figure 3
Figure 3
Time-domain double electron-electron resonance (DEER)/double-quantum coherence (DQC) data and reconstructed distance distributions, P(r), for doubly spin-labeled SBL1s. The residues involved in each measurement are specified simply by residue numbers in each subpanel. Most decays were obtained with DEER experiments, but those for A569R1–A619R1, A569R1–F782R1, and A619R1–F782R1 are from DQC experiments (all at 60 K). Decaying backgrounds in DEER data have been subtracted from the raw data, and the result normalized and shifted up to place the initial point at unity. DQC data, for better comparison with DEER data, were normalized to 1.0 at zero time and scaled down to nominal modulation depth, as modulation depth is not a relevant parameter for DQC (16,42). A 16-ns pump pulse was used to obtain all DEER data, except in the cases of 270/569 (32 ns) and 270/619 (20 ns). For 100% spin labeling efficiency, modulation depths will be 0.22, 0.31, and 0.36 when pump pulses are 32, 20, and 16 ns, respectively. Based on modulation depths, spin-labeling efficiency is 82–89% for the cases shown. Protein samples were 20–100 μM ± 5% in 0.1 M TRICINE-HCl (pH 8.4 at 22°C) with 30% sucrose (w/v).
Figure 4
Figure 4
LOPTC binds to a unique site in SBL1. (A) DEER data were recorded at 60 K for F270R1 (50 μM) and varied amounts of LOPTC (15.4–80 μM, top to bottom). (B) The modulation depth of decays in panel A was compared to a calibrated standard for determination of the fraction of the spins giving a defined dipolar interaction between F270R1 and bound LOPTC. Experimental results are presented as a Hill plot (solid circles, linear fit of slope 1.1, solid line), with LOPTC concentrations in μM. These data are compared to a plot calculated with Kd of 60 μM, on the assumption that 80% of the protein (40 μM) contributed to the dipolar interaction.
Figure 5
Figure 5
Distance determinations from the LOPTC spin to spins on SBL1. (A) Five single R1 SBL1 mutants (200 μM) with 0.8 equivalents of LOPTC, in TRICINE (0.1 M, pH 8.4 at 22°C), sucrose 30% (w/v), were examined by DEER, at 60 K. The maxima in the P(r) distributions are given in the footnote of Table 1. (B) Similar experiments measuring the distance between F782R1 and 8DSA, as the substrate analog, yielded a P(r) maximum at ∼30 Å. The 8-doxylstearic acid (8DSA) was added from an ethanol solution giving 1% ethanol in the final sample.
Figure 6
Figure 6
The LOPTC spin placed in the SBL1 structure (PDB:1YGE). (A) The experimental PDS solution for the location of the LOPTC spin is superimposed on the overall structure of SBL1(helices 2 and 11, slate gray). Helix 2 is separated into two portions by P268. The experimental LOPTC spin location (cyan ellipsoid) of radii 1.2, 2.3, and 3.0 Å, corresponding to the 1σ confidence level (distance distributions in one dimension), and an outer ellipsoid with radii twice those as an approximation of the 2σ confidence level. The coordinates of the center of the ellipsoid are 30.4, 62.2, and 12.2 Å. The catalytic Fe-water are colored by atom. The α-carbon atoms of side-chain pairs blocking possible entrances (3,4) into the cavity are show as colored spheres (yellow for T259 and L541, black for L255 and E753, and green for M341 and L480). (B) A portion of Fig. 6A (residues 213–276, 534–546, 750–756, and 840-841 (Fe-water)) is enlarged to provide details of the pocket in which the LOPTC spin resides (same orientation as in panel A). The loop region, composed of amino acids 213–254 (smooth loop) shows only the E236 side chain. Residues closest to the ellipsoid (cyan) are labeled (E236, K260, Q264, and Q544). (Lower region) E256 oxygens (helix 2) form a salt bridge with H248 (loop) and a hydrogen bond with N534 (helix 11). The orientation of SBL1 in this figure is related to that in Fig. 2 by rotations of the viewing direction by ∼40° about x and 30° about z.
None

Comment in

Similar articles

Cited by

References

    1. Haas U., Raschperger E., Haeggström J.Z. Targeted knock-down of a structurally atypical zebrafish 12S-lipoxygenase leads to severe impairment of embryonic development. Proc. Natl. Acad. Sci. USA. 2011;108:20479–20484. - PMC - PubMed
    1. Rådmark O., Werz O., Samuelsson B. 5-Lipoxygenase: regulation of expression and enzyme activity. Trends Biochem. Sci. 2007;32:332–341. - PubMed
    1. Boyington J.C., Gaffney B.J., Amzel L.M. The three-dimensional structure of an arachidonic acid 15-lipoxygenase. Science. 1993;260:1482–1486. - PubMed
    1. Minor W., Steczko J., Axelrod B. Crystal structure of soybean lipoxygenase L-1 at 1.4 Å resolution. Biochemistry. 1996;35:10687–10701. - PubMed
    1. Youn B., Sellhorn G.E., Kang C. Crystal structures of vegetative soybean lipoxygenase VLX-B and VLX-D, and comparisons with seed isoforms LOX-1 and LOX-3. Proteins. 2006;65:1008–1020. - PMC - PubMed

Publication types

LinkOut - more resources