. 2012 Dec 27;2(6):1684-96.
doi: 10.1016/j.celrep.2012.10.021. Epub 2012 Nov 29.

FGF regulates TGF-β signaling and endothelial-to-mesenchymal transition via control of let-7 miRNA expression

Affiliations

FGF regulates TGF-β signaling and endothelial-to-mesenchymal transition via control of let-7 miRNA expression

Pei-Yu Chen et al. Cell Rep. .

Abstract

Maintenance of normal endothelial function is critical to various aspects of blood vessel function, but its regulation is poorly understood. In this study, we show that disruption of baseline fibroblast growth factor (FGF) signaling to the endothelium leads to a dramatic reduction in let-7 miRNA levels that, in turn, increases expression of transforming growth factor (TGF)-β ligands and receptors and activation of TGF-β signaling, leading to endothelial-to-mesenchymal transition (Endo-MT). We also find that Endo-MT is an important driver of neointima formation in a murine transplant arteriopathy model and in rejection of human transplant lesions. The decline in endothelial FGF signaling input is due to the appearance of an FGF resistance state that is characterized by inflammation-dependent reduction in expression and activation of key components of the FGF signaling cascade. These results establish FGF signaling as a critical factor in maintenance of endothelial homeostasis and point to an unexpected role of Endo-MT in vascular pathology.


Figures

Figure 1
Figure 1. FRS2 regulates mesenchymal marker gene expression via the TGFβR1 pathway
(A) Immunofluorescence staining of VE-cadherin (red) and SM-calponin (green) in control and FRS2 knockdown HUAEC. Nuclei were counterstained with TO-PRO-3 (blue). Scale bar: 50 µm. (B) Immunoblots of SMC markers in control and FRS2 knockdown HUAEC. (C) Control or FRS2 knockdown HUAEC were analyzed by flow cytometry for CD31 and Dil-acLDL. (D) qPCR array mRNA expression profile of TGFβ family genes from control or FRS2 knockdown cells. (E) qRT-PCR analysis of TGFβRs and downstream target gene expression in control and FRS2 knockdown HUAEC. (*p<0.05; ***p<0.001 compared to control). β-actin was used to normalize the variability in template loading. (F) Immunoblots of TGFβR1, Smad2, mesenchymal, and endothelial cell markers in control and FRS2 knockdown HUAEC. (G–I) qRT-PCR analysis of SM-calponin and mesenchymal markers fibronectin and vimentin expression (**p<0.01; ***p<0.001; NS: not significant compared to control). β-actin was used to normalize the variability in template loading. Data shown are representative of four independent experiments (except (D)).
Figure 2
Figure 2. FRS2 knockdown downregulates let-7 family
(A) Control or FRS2 knockdown HUAEC were treated with DMSO or 10 µg/ml actinomycin D (ActD) for the indicated times. qRT-PCR was then used to determine TGFβR1 expression. 18S rRNA was used to normalize the variability in template loading. (B) Alignment of let-7 sequences with the 3’ UTRs of the human TGFβR1. (C) miRNA expression profiles assessed using real-time PCR miRNA arrays with cDNA from control or FRS2 knockdown cells. (D) qRT-PCR of TGFβR1 and SM-calponin in HUVEC transduced with Lin28, let-7 sponge expressing-or empty vector. β-actin was used to normalize the variability in template loading. (E) Immunoblots of TGFβR1, p-Smad2, Smad2, and FRS2 in control and FRS2 knockdown HUAEC transduced with let-7 lentiviruses. (F) qRT-PCR analysis of TGFβR1, TGFβ downstream target molecules, smooth muscle marker and mesenchymal marker gene expression in control and FRS2 knockdown HUAEC transduced with let-7 lentiviruses (*p<0.05; **p<0.01; ***p<0.001 compared to control). β-actin was used to normalize the variability in template loading. Data shown (A and D–F) are representative of three independent experiments. (G) Mice were injected intravenously with control or cholesterol formulated antagomir-let-7b/c (single injection of 2 mg/kg) and the liver endothelial cells were isolated at 6 days. Expression of let-7 miRNAs were analyzed by qRT-PCR. SNORD66 was used to normalize the variability in template loading (***p<0.001; NS: not significant compared to control). (H) Gene expression levels of K-ras, N-ras, HMGA2, CDK6, CDC25A, TGFβR1, and vimentin in liver endothelial cells of mice treated with control or formulated antagomir-let-7 at 6 days. β-actin was used to normalize the variability in template loading (*p<0.05; ***p<0.001 compared to control). (I) Immunofluorescence staining of CD31/vimentin (Nuclei were counterstained with DAPI (blue, scale bar: 7 µm.) in liver sections of mice treated with control or formulated antagomir-let-7 at 6 days. (J) Quantification of liver EC express vimentin in mice injected with control or formulated antagomir-let-7 (***p<0.001 compared to control).
Figure 3
Figure 3. Inflammatory cytokines (IFN-γ, TNF-α, and IL-1β) downregulate FGF receptors, thereby rendering EC less responsive to FGF in vitro and in vivo
(A) qRT-PCR analysis of smooth muscle and mesenchymal marker gene expression in control and human IFN-γ treated HUVEC (*p<0.05; **p<0.01; ***p<0.001 compared to control). β-actin was used to normalize the variability in template loading. (B) Immunoblots of smooth muscle and mesenchymal markers in control and human IFN-γ treated HUVEC. (C) HUVEC were treated with human IFN-γ (10 ng/ml), human TNF-α (10 ng/ml), or human IL-1β (10 ng/ml) in complete growth medium for 6 days followed by incubation in 0.5% FBS starvation medium for 18 hr. Cells were treated with FGF2 (50 ng/ml) for indicated times. Immunoblots of FGF signaling downstream targets. (D) qRT-PCR analysis of mature let-7 expression in control and human IFN-γ treated HUVEC. SNORD47 was used to normalize the variability in template loading. Data shown (A–D) are representative of four independent experiments. (E) Left: Immunofluorescence staining of p-ERK in adjacent aorta and graft sections in Cdh5-CreERT2;mT/mG mice. Scale bar: 10 µm. Right: Quantification of endothelial cell express p-ERK in mice injected with FGF2 (***p<0.001 compared to adjacent aorta).
Figure 4
Figure 4. Endo-MT participates in mouse arteriosclerosis
(A) Histological analysis of artery grafts by immunostaining with anti-Notch3, anti-αSMA, and anti-collagen 1. Cdh5-GFP+/Notch3+ (red) and Cdh5-GFP+/αSMA+ (red) colocalization indicates Endo-MT and appears yellow. Nuclei were counterstained with DAPI (blue). Scale bar: 10 µm for Notch3 and αSMA and 63 µm for collagen 1. L, lumen; N, neointima; white triangle indicates endothelial cells; yellow triangle indicates IEL (internal elastic lamina); arrows indicate endothelial cells express SMC markers. (B) Percentage of Notch3+ (left) or αSMA+ (right) cells that were Cdh5-GFP+ in neointima (*p<0.05; **p<0.01 compared to control). (C) Percentage of Cdh5-GFP+ cells that were Notch3+ (left) or αSMA+ (right) in neointima (**p<0.01 compared to control). (D) Percentage of Cdh5-GFP+ cells that were Notch3+ (left) or αSMA+ (right) in lumen (*p<0.05; **p<0.01; ***p<0.001 compared to control). (E–F) Morphometric assessment of collagen 1 area and artery graft neointima thickness was performed by computer-assisted microscopy (*p<0.05; **p<0.01 compared to control). PBS (N= 7 mice/group), Luc-control (N= 6 mice/group), iEC-FRS2KO (N= 4 mice/group), antagomir-let-7 (N= 9 mice/group), and let-7b mimics (N= 6 mice/group).
Figure 5
Figure 5. Endo-MT participates in human graft arteriosclerosis
(A–B) Representative images of human CD31 and Notch3 immunofluorescent staining of human normal and chronically rejecting human coronary arteries. Scale bar: 62 µm. L indicates lumen; white triangle indicates IEL (internal elastic lamina). (C–D) High-power images of human chronic rejection coronary artery lumen and neointima EC colocalized with Notch3 staining. Scale bar: 16 µm. Arrows indicate endothelial cells express SMC markers. (E) Percentage of CD31+ cells that were Notch3+ in lumen (***p<0.001 compared to normal artery). (F) Percentage of CD31+ cells that were Notch3+ in neointima (Ø, not detected). (G) Percentage of Notch3+ cells that were CD31+ in neointima (Ø, not detected). (H–I) Representative images of human CD31 and Notch3 immunofluorescent staining of human coronary artery transplants in SCID/beige mice reconstituted with or without human PBMCs. Scale bar: 62 µm. L indicates lumen; white triangle indicates IEL (internal elastic lamina). (J–K) High-power images of artery graft treated with human PBMC lumen and neointima EC colocalized with Notch3 staining. Scale bar: 16 µm. Arrows indicate endothelial cells express SMC markers. (L) Percentage of CD31+ cells that were Notch3+ in lumen (***p<0.001 compared to no PBMC). (M) Percentage of CD31+ cells that were Notch3+ in neointima (Ø, not detected). (N) Percentage of Notch3+ cells that were CD31+ in neointima (Ø, not detected).
Figure 6
Figure 6. Endo-MT in femoral artery wire injury and vein adaptation models
(A) a–b: Anatomy of the hindlimb vasculature. Blue lines indicate denuded endothelium layer. A, artery; V, vein; asterisks indicate wire inserted site. c–d: Representative images of cross sections of the uninjured (left) and injured (right) femoral arteries. e–f: Immunofluorescence staining of αSMA (red) in injured femoral artery sections 3 weeks after injury. L, lumen; N, neointima; M, media. (B) a: Schematic of vein to artery grafting. b–c: Immunofluorescence staining of CD31 (red) and αSMA (red) in low power magnification of inferior vena cava (IVC). d: Immunofluorescence staining of αSMA (red) in high power magnification of IVC. e–f: Immunofluorescence staining of CD31 (red) and αSMA (red) in low power magnification of vein grafts. g&i: Immunofluorescence staining of CD31 (red) in high power magnification of vein grafts 2 and 4 weeks after transplantation. h&j: Immunofluorescence staining of αSMA (red) in high power magnification of vein grafts 2 or 4 weeks after transplantation.
Figure 7
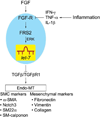
Figure 7. Schema of FGF-dependent regulation of TGFβ signaling and Endo-MT

References

    1. Acevedo L, Yu J, Erdjument-Bromage H, Miao RQ, Kim JE, Fulton D, Tempst P, Strittmatter SM, Sessa WC. A new role for Nogo as a regulator of vascular remodeling. Nature Medicine. 2004;10:382–388. - PubMed
    1. Basile DP, Friedrich JL, Spahic J, Knipe N, Mang H, Leonard EC, Changizi-Ashtiyani S, Bacallao RL, Molitoris BA, Sutton TA. Impaired endothelial proliferation and mesenchymal transition contribute to vascular rarefaction following acute kidney injury. American journal of physiology Renal physiology. 2011;300:F721–F733. - PMC - PubMed
    1. Chang AC, Fu Y, Garside VC, Niessen K, Chang L, Fuller M, Setiadi M, Smrz J, Kyle A, Minchinton A, Marra M, Hoodless PA, Karasan A. Notch initiates the endothelial-to-mesenchymal transition in the atrioventricular canal through autocrine activation of soluble guanylyl cyclase. Developmental cell. 2011;21:288–300. - PubMed
    1. Chen PY, Simons M, Friesel R. FRS2 via fibroblast growth factor receptor 1 is required for platelet-derived growth factor receptor beta-mediated regulation of vascular smooth muscle marker gene expression. J Biol Chem. 2009;284:15980–15992. - PMC - PubMed
    1. Costa MA, Simon DI. Molecular basis of restenosis and drug-eluting stents. Circulation. 2005;111:2257–2273. - PubMed

Publication types

MeSH terms