. 2012 Dec 27;2(6):1697-709.
doi: 10.1016/j.celrep.2012.10.025. Epub 2012 Nov 29.

Epistasis between microRNAs 155 and 146a during T cell-mediated antitumor immunity

Affiliations

Epistasis between microRNAs 155 and 146a during T cell-mediated antitumor immunity

Thomas B Huffaker et al. Cell Rep. .

Abstract

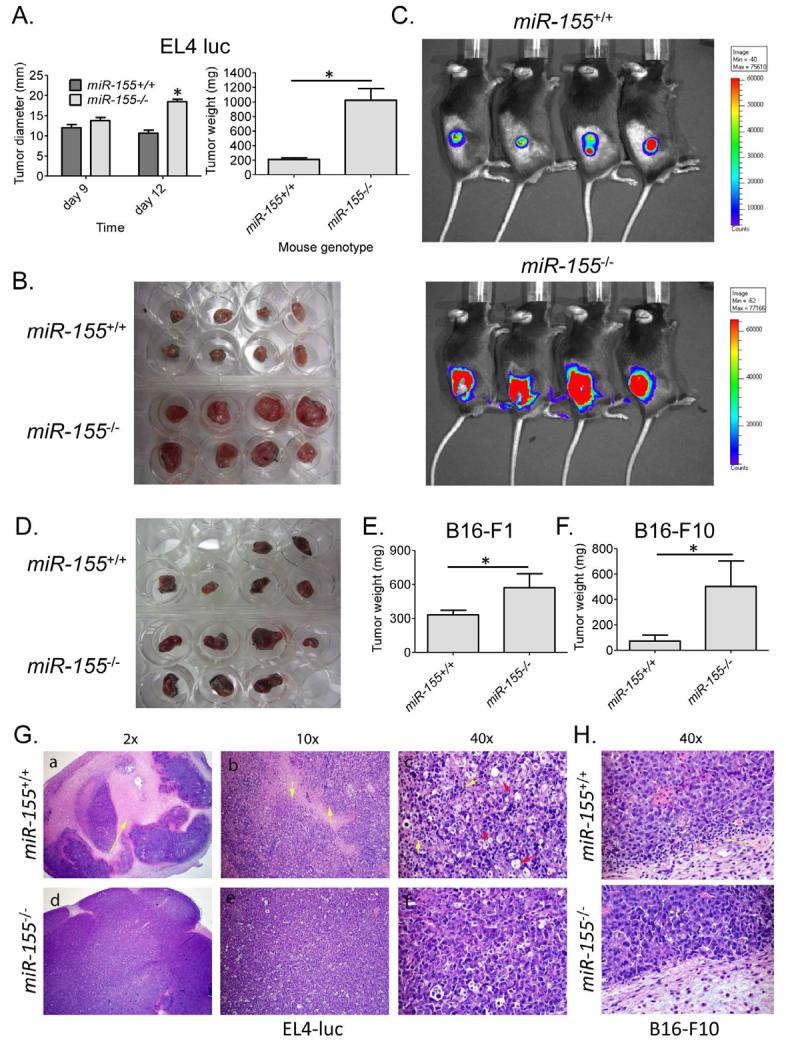
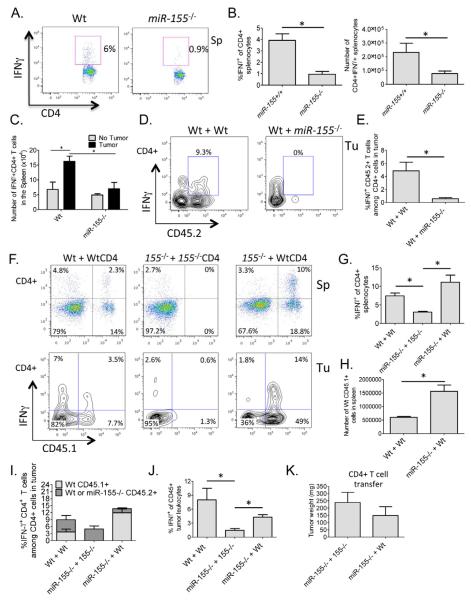
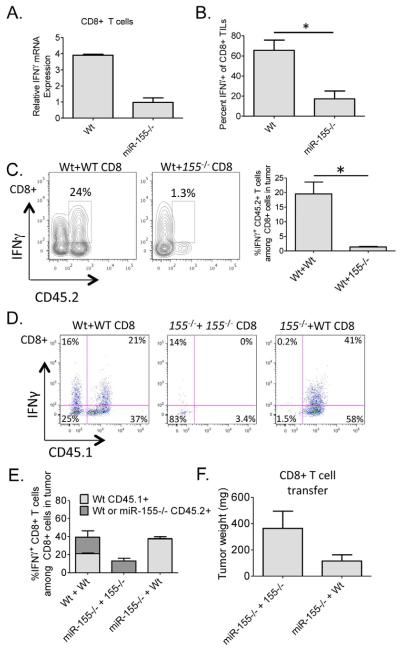
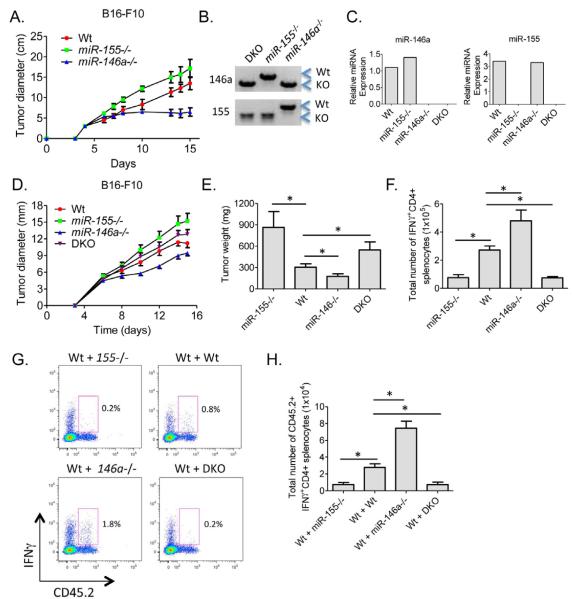
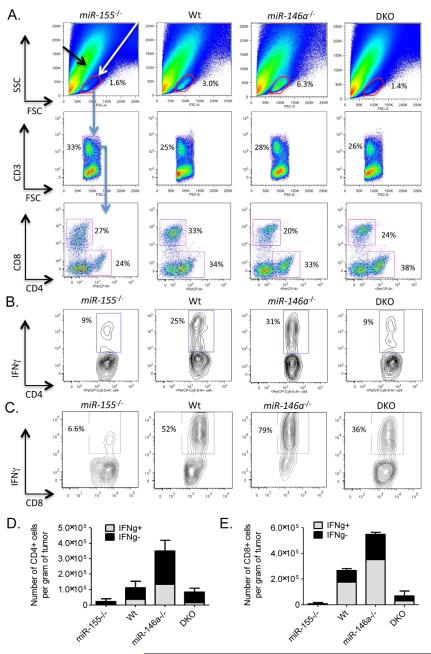
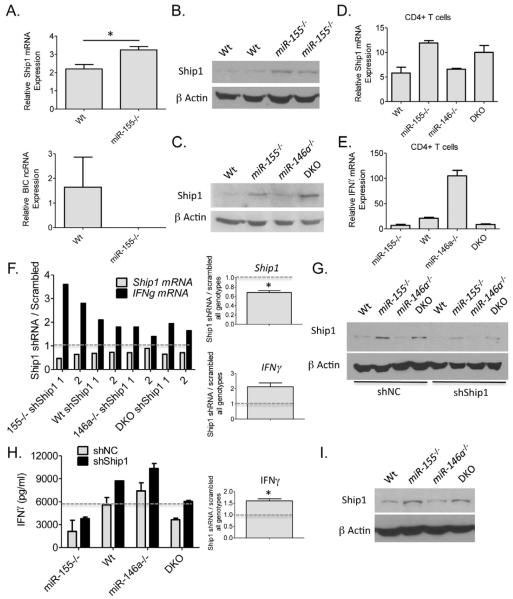
An increased understanding of antitumor immunity is necessary for improving cell-based immunotherapies against human cancers. Here, we investigated the roles of two immune system-expressed microRNAs (miRNAs), miR-155 and miR-146a, in the regulation of antitumor immune responses. Our results indicate that miR-155 promotes and miR-146a inhibits interferon γ (IFNγ) responses by T cells and reduces solid tumor growth in vivo. Using a double-knockout (DKO) mouse strain deficient in both miR-155 and miR-146a, we have also identified an epistatic relationship between these two miRNAs. DKO mice had defective T cell responses and tumor growth phenotypes similar to miR-155(-/-) mice. Further analysis of the T cell compartment revealed that miR-155 modulates IFNγ expression through a mechanism involving repression of Ship1. Our work reveals critical roles for miRNAs in the reciprocal regulation of CD4(+) and CD8(+) T cell-mediated antitumor immunity and demonstrates the dominant nature of miR-155 during its promotion of immune responses.


Figures

Figure 1
Figure 1. Enhanced solid tumor growth in miR-155−/− mice
(A) Wt and miR-155−/− mice were administered 2×10⁶ EL4-luc cells subcutaneously in their rear flanks and tumor growth was monitored over time (n=8). Tumor diameters and weights after 12 days are shown. (B) Tumors dissected from the mice in A. (C) Live animal imaging was performed to detect tumor expression of luciferase. (D) Wt and miR-155−/− mice were challenged with 1×10⁶ B16-F1 cells and their growth was followed for 14 days. The dissected tumors from the groups are shown. (E) Tumor weights from D, or (F) from mice given 5×10⁵ B16-F10 melanoma cells for 19 days are shown (n=5-7). (G) H&E stained EL4-luc, or (H) B16-F10, tumor sections from Wt or miR-155−/− mice shown at the indicated magnifications. * denotes a p value less than 0.05. Data are presented as +/− SEM. In the 2x and 10x images the yellow arrows indicate necrosis. In the 40x picture, the yellow arrows indicate TILs and the red arrows indicate macrophages. See also Figure S1.
Figure 2
Figure 2. miR-155 promotes IFNγ+CD4+ T cell formation in tumor bearing mice through a CD4+ T cell intrinsic mechanism
(A) IFNγ expression by CD4+ T cells from the spleens of EL4-luc tumor bearing Wt or miR-155−/− mice following 12 days of tumor growth. (B) Results from A are shown graphically for multiple mice (n=5). (C) Number of IFNγ+CD4+ T cells in the spleens of Wt or miR-155−/− mice with and without B16-F10 tumors for 14 days. (D) FACS plots (gated on CD4+ T cells) showing IFNγ expression by transferred Wt or miR-155−/− CD45.2+ CD4+ T cells in the tumors of Wt CD45.1+ B16-F10 tumor bearing mice. (E) Graphs from multiple mice in D (n=5). (F) FACS plots showing IFNγ expression by transferred Wt CD45.1+ CD4+ T cells in the spleens (top) or tumors (bottom) of Wt or miR-155−/− CD45.2+ B16-F10 tumor bearing mice. Note: transferred miR-155−/− CD4+ cells are CD45.2+ and all plots are gated on CD4+ T cells. (G) Graph showing IFNγ expression by the splenic CD4+ T cell compartment in B16-F10 tumor bearing miR-155−/− mice receiving Wt CD4+ T cells (n=5-7). (H) Total number of engrafting CD45.1+ Wt CD4+ T cells in Wt versus miR-155−/− tumor bearing mouse spleens. (I) Graph showing the percentage of IFNγ+CD4+ T cells among total CD4+ T cells in the tumor. Contribution by transferred vs. endogenous cells is also shown. (J) The amount of IFNγ-expressing CD45+ cells among total CD45+ cells in the B16-F10 tumors is shown graphically for multiple mice of the indicated genotypes (n=5-7). (K) Tumor weights from J. * denotes a p value less than 0.05. Data are presented as +/− SEM. Tu - tumor, Sp - spleen. See also Figures S2 and S3.
Figure 3
Figure 3. miR-155 promotes IFNγ+CD8+ T cell responses in tumor bearing mice through a CD8+ T cell intrinsic mechanism
(A) Expression levels of IFNγ in αCD3 and αCD28 activated CD8+ splenic T cells from Wt or miR-155−/− mice were assayed by qPCR. (B) The percentage of IFNγ+CD8+ TILs among total CD8+ TILs from tumors growing in Wt or miR-155−/− mice (n=5). (C) FACS plots of B16-F10 tumor cell suspensions looking at IFNγ expression by the transferred Wt and miR-155−/− CD45.2+ CD8+ T cells in CD45.1 Wt tumor bearing hosts (n=5). Plots are gated on CD8+ T cells. (D) FACS plots of B16-F10 tumor cell suspensions looking at IFNγ expression by the transferred Wt CD45.1+ CD8+ T cells in Wt or miR-155−/− CD45.2+ tumor hosts. Plots are gated on CD8+ T cells. (E) The percentage of CD45.2+ endogenous CD8+ TILs versus transferred Wt CD45.1+ CD8+ TILs expressing IFNγ among total CD8+ T cells is shown graphically for multiple mice of the indicated genotypes (n=5-7). (F) Tumor weights from D are shown. * denotes a p value less than 0.05. Data are presented as +/− SEM.
Figure 4
Figure 4. Enhanced tumor growth and defective numbers of IFNγ-expressing CD4+ T cells in miR-155−/− miR-146a−/− DKO mice
(A) Wt, miR-155−/− and miR-146a−/− mice were inoculated subcutaneously with 1×10⁶ B16-F10 tumor cells and the tumor diameters were measured over a 15-day time course (n=5). (B) Genotyping results from PCR assays demonstrating the generation of miR-155 and miR146a double knockout (DKO) mice. (C) Expression of miR-155 or miR-146a in activated CD4+ T cells from the indicated genotypes. (D) B16-F10 tumor growth in Wt, miR-155−/−, miR-146a−/− and DKO mice (n=10). (E) Tumor weights following resection 15 days after tumor cell injection (n=15-24). (F) Total number of IFNγ+CD4+ T cells in the spleens of Wt, miR-155−/−, miR-146a−/− and DKO tumor bearing mice (n=5). (G) CD45.2+ Wt, miR-155−/−, miR-146a−/− or DKO naïve CD4+ T cells were injected into sub-lethally irradiated CD45.1+ Wt mice one day before being inoculated with 5 × 10⁵ B16-F10 cells. IFNγ expression by the transferred CD4+ T cells in the spleens of tumor bearing mice was assayed 15 days later. (H) Number of IFNγ expressing cells from G is shown (n=5). * denotes a p value less than 0.06. Data are presented as +/− SEM.
Figure 5
Figure 5. Dominant role for miR-155 versus miR-146a during T cell-mediated antitumor immune responses
(A) Representative FACS plots showing the percentage of tumor infiltrating CD3+CD4+ and CD3+CD8+ TILs in Wt, miR-155−/−, miR-146a−/− and DKO mice (n=5). Representative FACS plot demonstrating expression of IFNγ by (B) CD4+ and (C) CD8+ TILs from the indicated genotypes (n=5). The number (per gram of tumor) of IFNγ+ and IFNγ- (D) CD3+CD4+ or (E) CD3+CD8+ TILs sorted from tumors growing in the different genotypes is shown. Data represent two independent experiments. Data are presented as +/− SEM. See also Figure S4.
Figure 6
Figure 6. Ship1 is a target of miR-155 in T lymphocytes
(A) Expression levels of Ship1 mRNA and BIC ncRNA were determined in CD4+ T cells purified from the spleens of tumor bearing mice Wt and miR-155−/− mice (n=4). (B) Expression of Ship1 was quantified in activated Wt and miR-155−/− CD4+ T cells by Western blotting. Data from two Wt and two miR-155−/− mouse T cell donors are shown. (C) and (D) Expression of Ship1 in αCD3 and αCD28 activated CD4+ splenic T cells from Wt, miR-155−/−, miR-146a−/− and DKO mice was assayed by Western blotting and qPCR. (E) Expression of IFNγ mRNA in the same cells from D is shown (n=2). (F) αCD3 and αCD28 antibody activated CD4+ splenic T cells from Wt, miR-155−/−, miR-146a−/− and DKO mice were transduced with a control or one of two different Ship1 siRNA producing retroviral vectors after 24 hours of activation. Expression of Ship1 and IFNγ mRNA levels were assayed by qPCR after 72 hours of knockdown. Data are presented as the ratio of expression in the siRNA vs. control (scrambled) conditions. The average knockdown of Ship1 or increase in IFNγ for all genotypes is shown on the right. (G) Knockdown of Ship1 in the different cell types by the Ship1 shRNA was determined by Western blotting. (H) Retroviral transduction of shRNAs against Ship1 into CD4+ T cells from the indicated genotypes was performed as in F. IFNγ protein concentrations in the supernatants were determined by ELISA 72 hours after T cell activation. (I) Ship1 expression levels were determined by Western blotting in αCD3 and αCD28 activated CD8+ T cells from the indicated genotypes. Average increase in IFNγ for all genotypes is shown on the right. * denotes a p value less than 0.05. Data are presented as +/− SEM. See also Figures S5 and S6.

References

    1. Bakirtzi K, Hatziapostolou M, Karagiannides I, Polytarchou C, Jaeger S, Iliopoulos D, Pothoulakis C. Neurotensin signaling activates microRNAs-21 and -155 and Akt, promotes tumor growth in mice, and is increased in human colon tumors. Gastroenterology. 2011;141:1749–1761. e1741. - PMC - PubMed
    1. Boldin MP, Taganov KD, Rao DS, Yang L, Zhao JL, Kalwani M, Garcia-Flores Y, Luong M, Devrekanli A, Xu J, et al. miR-146a is a significant brake on autoimmunity, myeloproliferation, and cancer in mice. J Exp Med. 2011a;208:1189–1201. - PMC - PubMed
    1. Boldin MP, Taganov KD, Rao DS, Yang L, Zhao JL, Kalwani M, Garcia-Flores Y, Luong M, Devrekanli A, Xu J, et al. miR-146a is a significant brake on autoimmunity, myeloproliferation, and cancer in mice. J Exp Med. 2011b - PMC - PubMed
    1. Chang S, Wang RH, Akagi K, Kim KA, Martin BK, Cavallone L, Haines DC, Basik M, Mai P, Poggi E, et al. Tumor suppressor BRCA1 epigenetically controls oncogenic microRNA-155. Nat Med. 2011;17:1275–1282. - PMC - PubMed
    1. Cubillos-Ruiz JR, Baird JR, Tesone AJ, Rutkowski MR, Scarlett UK, Camposeco-Jacobs AL, Anadon-Arnillas J, Harwood NM, Korc M, Fiering SN, et al. Reprogramming tumor-associated dendritic cells in vivo using miRNA mimetics triggers protective immunity against ovarian cancer. Cancer Res. 2012;72:1683–1693. - PMC - PubMed

Publication types

MeSH terms

Substances