Review
. 2013 Jan:295:100-13.
doi: 10.1016/j.heares.2012.11.016. Epub 2012 Nov 27.

Salicylate-induced cochlear impairments, cortical hyperactivity and re-tuning, and tinnitus

Affiliations
Review

Salicylate-induced cochlear impairments, cortical hyperactivity and re-tuning, and tinnitus

Guang-Di Chen et al. Hear Res. 2013 Jan.

Abstract

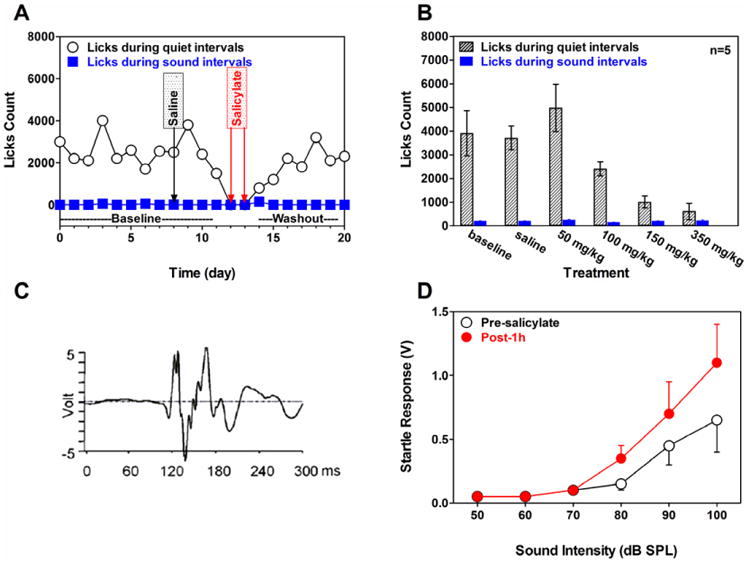
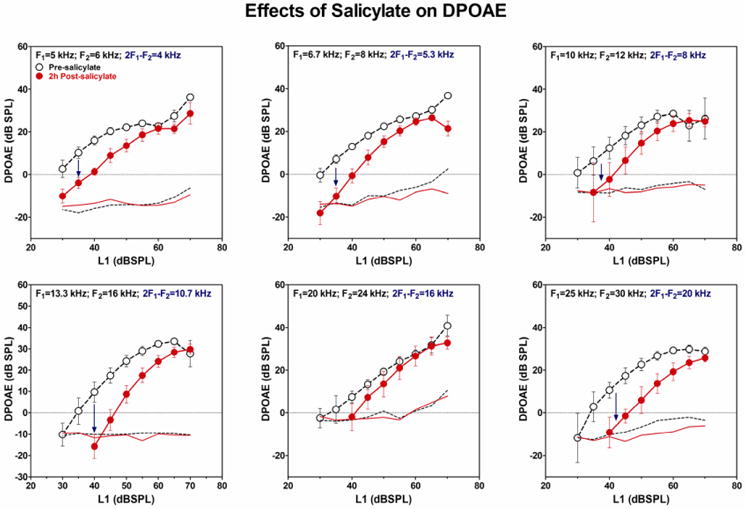
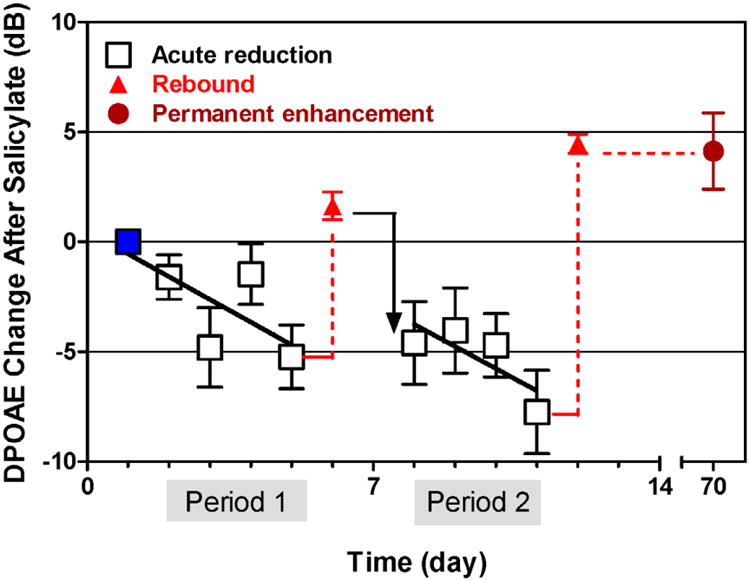
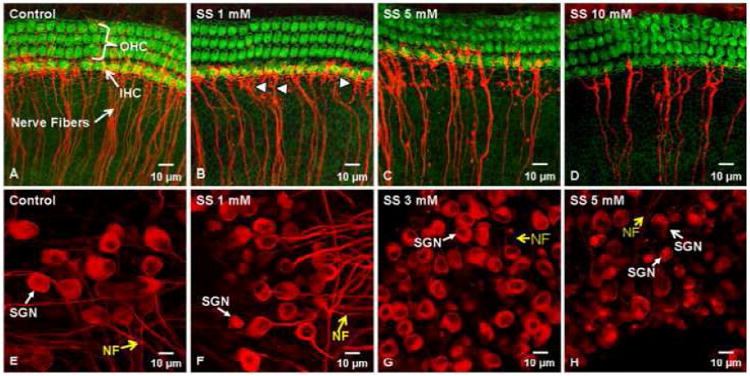
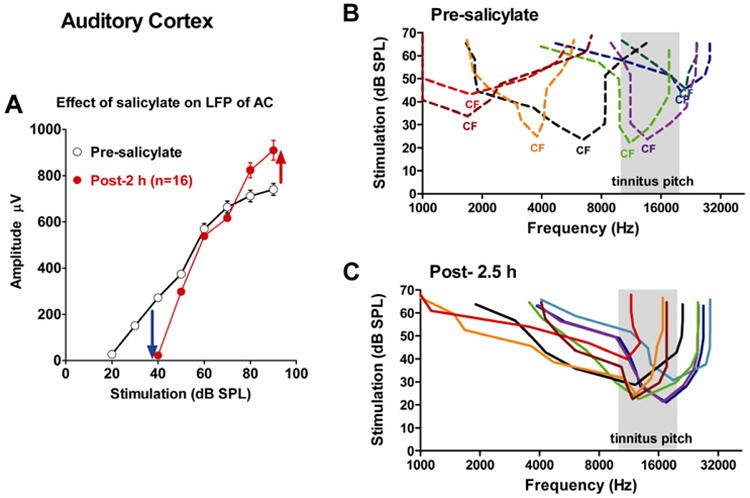
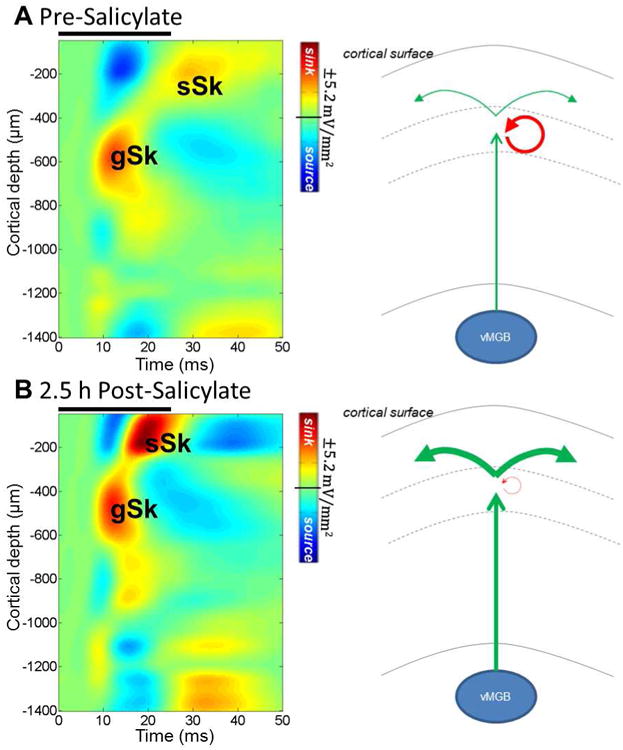
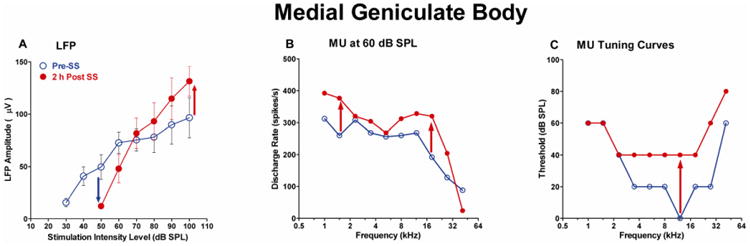
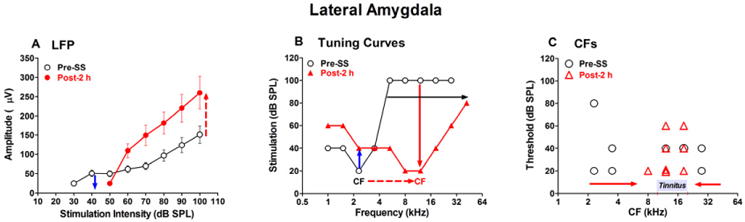
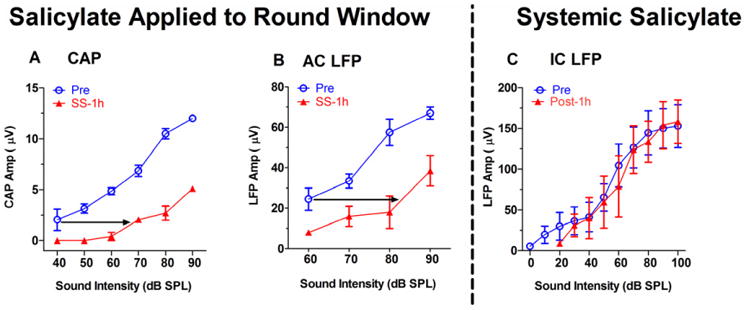
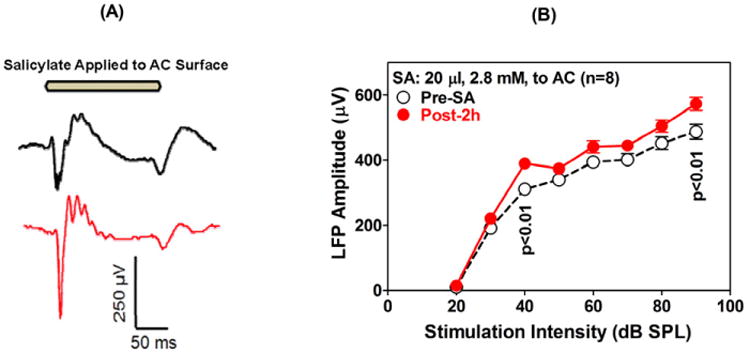
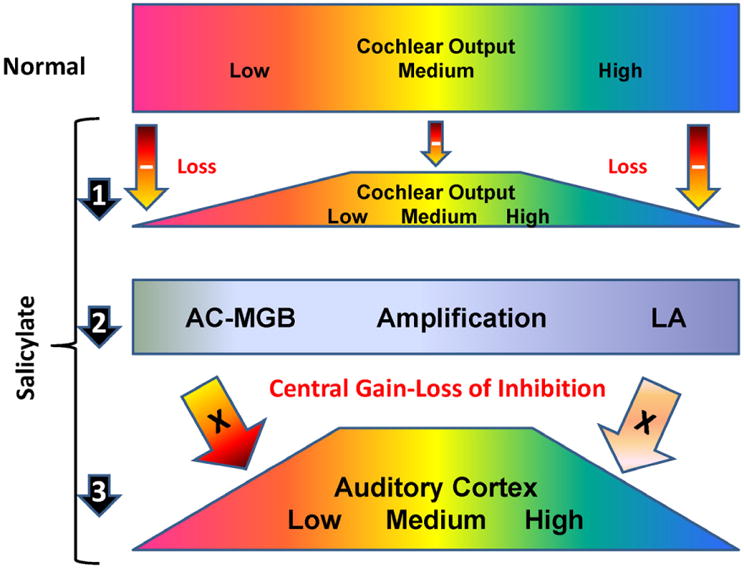
High doses of sodium salicylate (SS) have long been known to induce temporary hearing loss and tinnitus, effects attributed to cochlear dysfunction. However, our recent publications reviewed here show that SS can induce profound, permanent, and unexpected changes in the cochlea and central nervous system. Prolonged treatment with SS permanently decreased the cochlear compound action potential (CAP) amplitude in vivo. In vitro, high dose SS resulted in a permanent loss of spiral ganglion neurons and nerve fibers, but did not damage hair cells. Acute treatment with high-dose SS produced a frequency-dependent decrease in the amplitude of distortion product otoacoustic emissions and CAP. Losses were greatest at low and high frequencies, but least at the mid-frequencies (10-20 kHz), the mid-frequency band that corresponds to the tinnitus pitch measured behaviorally. In the auditory cortex, medial geniculate body and amygdala, high-dose SS enhanced sound-evoked neural responses at high stimulus levels, but it suppressed activity at low intensities and elevated response threshold. When SS was applied directly to the auditory cortex or amygdala, it only enhanced sound evoked activity, but did not elevate response threshold. Current source density analysis revealed enhanced current flow into the supragranular layer of auditory cortex following systemic SS treatment. Systemic SS treatment also altered tuning in auditory cortex and amygdala; low frequency and high frequency multiunit clusters up-shifted or down-shifted their characteristic frequency into the 10-20 kHz range thereby altering auditory cortex tonotopy and enhancing neural activity at mid-frequencies corresponding to the tinnitus pitch. These results suggest that SS-induced hyperactivity in auditory cortex originates in the central nervous system, that the amygdala potentiates these effects and that the SS-induced tonotopic shifts in auditory cortex, the putative neural correlate of tinnitus, arises from the interaction between the frequency-dependent losses in the cochlea and hyperactivity in the central nervous system.


Figures

Figure 1
Figure 1
(A) Typical behavior of a rat trained on the SIPAC paradigm. Lick counts during Quiet intervals and Sound intervals were obtained during each day of baseline testing, treatment with saline, treatment with 350 mg/kg/d SS and the washout period. (B) SS dose-response function obtained with SIPAC paradigm. Mean lick counts (±SEM, n=5) measured during Quiet intervals (gray) and Sound intervals (blue). During baseline and saline sessions, lick counts were high during Quiet intervals and low during sound interval; licking behavior remained largely unchanged after treatment with 50 mg/kg SS. Lick counts in Quiet systematically declined as SS dose increased from 100 to 350 mg/kg/d; lick count at 150 mg/kg/d and 350 mg/kg/d significantly less (p<0.05) than baseline, behavior consistent with tinnitus. Lick counts during Sound intervals were unaffected by SS dose. (C) Typical startle response of a rat to a 50-ms broadband noise presented at 115 dB SPL. Voltage-time output from piezo transducer following startle stimulus. (D) Mean startle amplitude (±SEM, n=12) plotted as a function of startle stimulation level pre-salicylate and 1 h after treatment with 250 mg/kg of salicylate.
Figure 2
Figure 2
Mean (±SEM, n=5) DPOAE amplitudes plotted as a function of L1 intensity pre-salicylate and 2 h post-salicylate (300 mg/kg). F2/F1 =1.2, L1 = +10 dB re L2, F1, F2, 2F1-F2 indicated in each panel. DPOAE amplitudes decreased significantly (dark blue arrows) at all frequencies following salicylate treatment except at 2F1-F2 = 16 kHz. Dashed line shows noise floor at frequencies surrounding 2F1-F2.
Figure 3
Figure 3
Mean change (±SEM) in DPOAE amplitude after repeated salicylate injections. Sprague-Dawley rats (n=8) were injected with 300 mg/kg/d of salicylate for 4 days in period 1 and for 4 days in period 2. During period 1 and period 2, DPOAE were measured on each day of injection (open squares) and again after 2 days of rest (red filled triangles) and finally 70 day later. DPOAE measured at 3 frequencies (F2 = 8, 12, and 16 kHz) and at L1 = 60 dB SPL). Measurement made 2 h after each injection period (squares), 24 h after each rebound/rest period (red triangle) and at 70 days (dark red circle). Note decline in DPOAE amplitude during daily salicylate treatment and rebound in DPOAE amplitude after 2-day rest intervals and at 70 days.
Figure 4
Figure 4
(A-C) Mean (±SEM, n=5) CAP input/output function obtained pre- and 2 h post-SS (300 mg/kg) at 8, 16 and 40 kHz. Dashed line represents a linear relationship between log CAP amplitude and stimulus level in dB SPL. Post-SS CAP input/output functions shifted approximately 30 dB to the right at low intensities at 8 and 40 kHz and about 20 dB to the right at 16 kHz. Post-SS input/output functions linear or nearly linear at 40 and 8 kHz respectively; 16 kHz input/output function retains its nonlinearity. Residual nonlinear amplification shown by the horizontal blue arrows; cochlear amplification retained at 16 kHz, but lost or greatly reduced at 40 and 8 kHz respectively. (D-E) The permanent effects of repeated salicylate treatments (200 mg/kg/day, 5 days/week for 3 weeks) on mean (±SEM, n=6) CAP amplitude. Note parallel shift to the right of CAP-I/O function (D) and a frequency-dependent CAP amplitude reduction at 70 dB SPL (E) with less impairment in the middle frequency region.
Fig. 5
Fig. 5
Cochlear organotypic cultures from postnatal day 3 rats labeled with Alexa-488 conjugated phalloidin to identify F-actin that is heavily expressed in the stereocilia and cuticular plate of outer hair cells (OHC) and inner hair cells (IHC). Nerve fibers (NF) and spiral ganglion neurons (SGN) labeled with a monoclonal antibody against class III –tubulin and Cy3-conjugated secondary antibody (red). (A-D) Control culture and cultures treated with escalating doses of SS for 48 h. Note loss of NF as SS dose increases; arrowhead points to NF. (E-H) Photomicrographs show SGN and NF from postnatal day 3 cochlear cultures. Note large round SGN and nerve fibers (NF) emanating from the soma of control cultures. Treatment with escalating doses of SS for 48 h results in loss of NF and shrinkage of SGN. (From Wei et al., 2010 with permission).
Figure 6
Figure 6
(A) Mean (±SEM, n=16) AC LFP I/O functions measured with noise bursts pre- and 2 h post treatment with SS (300 mg/kg, i.p.). SS induced a threshold shift of approximately 20 dB (blue arrow), but increased LFP amplitudes at high levels (red arrow). (A) FRF of AC neurons measured pre-SS (color coded, dashed lines) and (B) 2 h post-SS (color-code in panel C same as in panel B; but dashed lines converted to solid lines).
Figure 7
Figure 7
Effects of SS on sound processing in the microcircuitry of A1. Left panels: Heat maps showing mean sound-evoked current source density (CSD) responses with amplitude (mV/mm2) of current sink indicated in red and amplitude of current source indicated in blue. Location of CSD sinks and sources relative to cortical surface indicated on ordinate; approximate depth of cortical layers 1-6 shown adjacent to ordinate. Change in CSD sources and sinks plotted as a function of time (abscissa) after onset of noise burst (25 ms). CSD heat maps are shown for the same rat before (A) and following (B) systemic 250 mg/kg of SS (i.p.). Note increase in gSk and even greater increase in sSk after salicylate treatment (panel B vs. A). Black bars above maps indicate 25 ms broadband noise burst at 90 dB SPL. Right panels: Highly simplified schematics of activation patterns in response to sound. Normally, strong thalamic drive is initially received by granular layers) from the ventral portion of the medial geniculate body (vMGB), followed by recurrent inhibition (red arrow) and activation of local and long range excitatory intracortical projections (green arrows) which play a role in spectral integration. Following a high systemic dose of SS, thalamic activation of the granular layer (gSk) is enhanced (indicated by increased thickness of vertical arrow in panel B), but reduced recurrent inhibition by SS treatment results in abnormally large activation of excitatory intracortical projections (sSk, indicated by extra large increase in thickness of horizontal arrows in panel B). Increased activation of these intracortical fibers manifests as broadened multiunit frequency receptive fields.
Figure 8
Figure 8
Effects of SS (300 mg/kg, i.p.) on MGB. (A) Mean (±SEM, n=5) LFP input/output function to noise bursts recorded pre- and 2 h post-SS. LFP threshold increased approximately 20 dB after SS treatment. LFP amplitude was below normal at stimulation level below 70 dB SPL (blue arrow), but was approximately 30% greater than normal at 100 dB SPL (red arrow). (B) Discharge rate vs. frequency plots recorded at 60 dB SPL from a representative multiunit cluster pre- and 2 h post-SS. Note increase in firing rate Post-SS (red, up arrows). (C) Tuning curve showing threshold vs. frequency pre- and 2 h post-SS. The tuning curve is broader post-SS due to selective threshold elevation around the original characteristic frequency (CF) near 12 kHz.
Figure 9
Figure 9
Effects of SS (300 mg/kg, i.p.) on the lateral amygdala (LA). (A) Mean (±SEM, n=19) LFP input/output functions elicited with noise bursts pre- and 2 h post-SS. Salicylate induced a 20 dB threshold shift and decreased the amplitude at low intensities (blue, down arrow). Post-SS amplitudes were much higher than normal at stimulation intensities of 60 dB SPL or higher (red, up arrow). (B) Tuning curve (threshold vs. frequency plot) of a representative LA multiunit cluster. Original CF threshold was 20 dB near 2 kHz. CF shifted to approximately 12 kHz 2 h post-SS, CF threshold remained at 20 dB SPL, but the tuning curve was much broader. (C) CFs of 8 multiunit clusters in the LA before (black circles) and 2 h post-SS (red triangles). Most low-CF and high-CF neurons up-shift or down-shift (arrows) their CFs to the mid-frequencies where the tinnitus pitch was detected in our previous behavioral studies (Yang et al., 2007). CFs of mid-frequency neurons largely unchanged.
Figure 10
Figure 10
Effect of SS application (∼50 μl, 25 mg/ml) to the cochlear round window membrane on the mean (±SEM) CAP (A) and AC LFP (B) input/output functions. The cochlear application of SS elevated threshold approximately 20 dB and reduced the amplitude of the CAP and AC LFP at all intensity levels. (C) Mean (±SEM, n=4) LFP input/output function from IC pre- and 1 h post systemic SS treatment (i.p. 250 mg/kg).
Figure 11
Figure 11
(A) LFP recorded from AC in response to a 200 ms tone burst (bar on the top) presented at 90 dB SPL. The LFP was recorded pre (top) and approximately 1 minute after applying SS (100 μl, 2 mM) on the AC (bottom). The LFP amplitude increased roughly two-fold after SS treatment. (B) Mean LFP amplitudes after applying SS on the AC (20 μL, 2.8 mM). Note increase of LFP amplitude without a threshold shift.
Figure 12
Figure 12
Infusion of SS (20 μl, 2.8 mM) into LA while recording from AC pre- and post-treatment. (A) Mean (±SEM, n=18) AC LFP input/output function to noise bursts obtained pre- and 2 h post-SS. Note large increase in LFP amplitude without threshold shift. (B-C) Matrix of peristimulus time histograms (PSTHs) obtained with tone bursts presented at 10 different frequencies (x-axis) at 6 intensities ranging from 0 to 100 dB SPL (y-axis). PSTH in each square shows the firing rate as a function of time (5 ms bin width, 500 ms total duration) to the 50 ms tone burst. Dashed blue line in panel B outlines FRF of the AC multiunit cluster prior to SS treatment; dashed red line in panel C outlines FRF of the multiunit cluster 2 h after infusing SS into the LA (blue dashed line from panel B also shown in panel C). Red horizontal arrow in panel C shows expansion of FRF towards the high frequencies. (D) Mean (±SEM) tuning curve of 3 (out of 16) multiunit clusters showing expansion of response area of low-frequency neurons towards the middle frequencies after SS infusion; response area shift towards the tinnitus pitch.
Figure 13
Figure 13
Schematic illustrating the effects of SS and the cochlea and CNS. (1) SS-induced a frequency-dependent reduction in cochlear output with greater loss at low and high frequencies compared to the mid-frequencies. Compare normal profile in top row to profile in arrow 1; note frequency dependent loss; “-” inside arrows indicates decreased output, length of the arrow indicates degree of loss). (2) SS-induced increase in central gain resulting in part from a loss of inhibition within the AC and MGB. In addition, the LA acts to further amplify (arrow 2) the frequency-dependent changes in the cochlear output and (3) the enhancement in AC activity and CF shifts that focuses AC tonotopy to the mid-frequencies. The increased number of mid-frequency neurons leads to an increase in the total number of spontaneous discharges associated with the mid-frequencies; this over-representation may lead to a mid-frequency, phantom sound sensation. X's within arrow indicate amplification of incoming neural signals from the MGB and LA. The frequency-dependent changes in the cochlea amplified by the LA and AC results in an enhanced mid-frequency response and altered AC tonotopy (arrow 3).

References

    1. Akada S, Takeda S, Ogawa R. Salicylate action on medullary inspiratory neuron activity in a brainstem-spinal cord preparation from newborn rats. Anesth Analg. 2003;96:407–11. table of contents. - PubMed
    1. Anari M, Axelsson A, Eliasson A, Magnusson L. Hypersensitivity to sound--questionnaire data, audiometry and classification. Scand Audiol. 1999;28:219–30. - PubMed
    1. Andersson G, Lindvall N, Hursti T, Carlbring P. Hypersensitivity to sound (hyperacusis): a prevalence study conducted via the Internet and post. Int J Audiol. 2002;41:545–54. - PubMed
    1. Baguley DM. Hyperacusis. J R Soc Med. 2003;96:582–5. - PMC - PubMed
    1. Bauer CA, Brozoski TJ, Holder TM, Caspary DM. Effects of chronic salicylate on GABAergic activity in rat inferior colliculus. Hear Res. 2000;147:175–82. - PubMed

Publication types

MeSH terms

Substances