

Genetic influences on composite neural activations supporting visual target identification
- PMID: 23201034
- PMCID: PMC3579495
- DOI: 10.1016/j.biopsycho.2012.11.016
Genetic influences on composite neural activations supporting visual target identification
Abstract
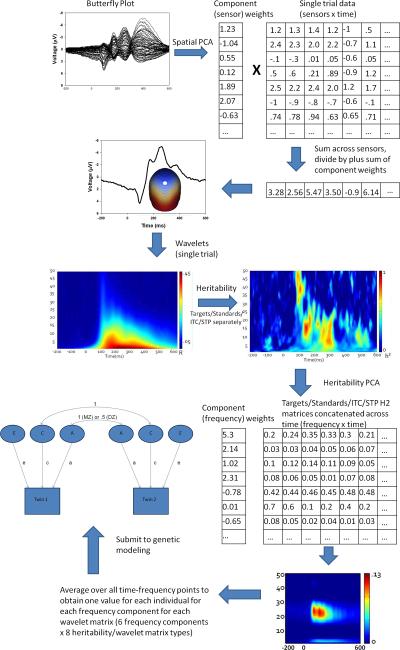
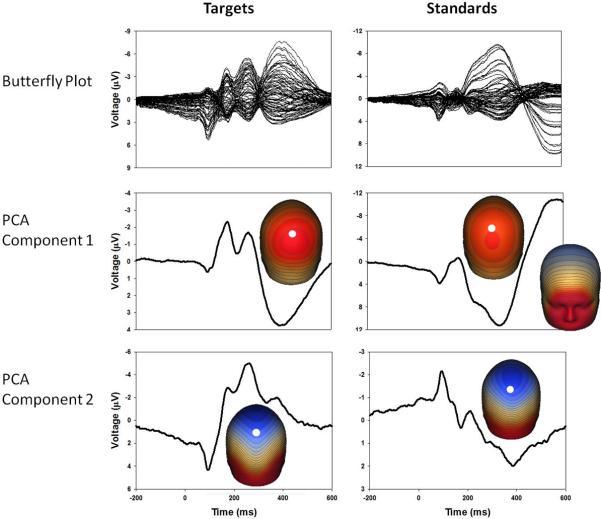
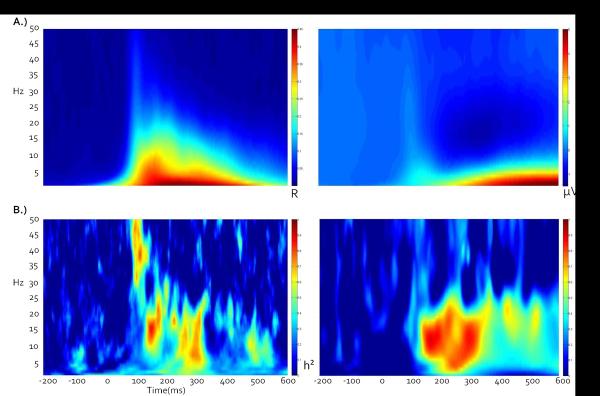
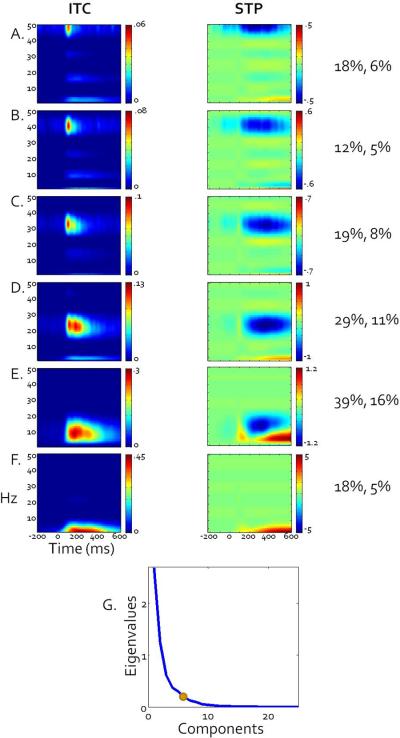
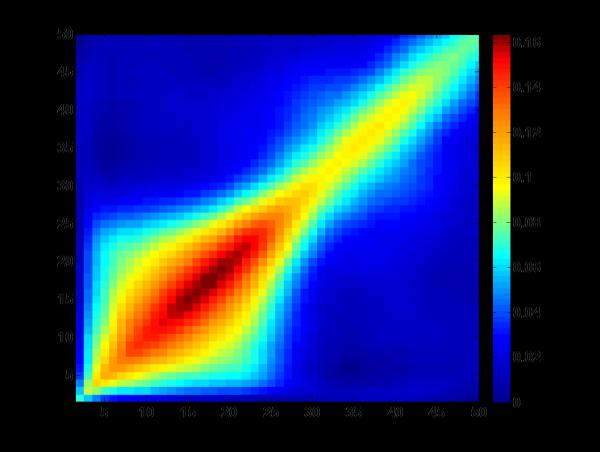
Behavior genetic studies of brain activity associated with complex cognitive operations may further elucidate the genetic and physiological underpinnings of basic and complex neural processing. In the present project, monozygotic (N=51 pairs) and dizygotic (N=48 pairs) twins performed a visual oddball task with dense-array EEG. Using spatial PCA, two principal components each were retained for targets and standards; wavelets were used to obtain time-frequency maps of eigenvalue-weighted event-related oscillations for each individual. Distribution of inter-trial phase coherence (ITC) and single trial power (STP) over time indicated that the early principal component was primarily associated with ITC while the later component was associated with a mixture of ITC and STP. Spatial PCA on point-by-point broad sense heritability matrices revealed data-derived frequency bands similar to those well established in EEG literature. Biometric models of eigenvalue-weighted time-frequency data suggest a link between physiology of oscillatory brain activity and patterns of genetic influence.
Copyright © 2012 Elsevier B.V. All rights reserved.
Figures
Similar articles
-
Genetic effects on source level evoked and induced oscillatory brain responses in a visual oddball task.Biol Psychol. 2016 Feb;114:69-80. doi: 10.1016/j.biopsycho.2015.12.006. Epub 2015 Dec 29. Biol Psychol. 2016. PMID: 26744236
-
Genetic influences on phase synchrony of brain oscillations supporting response inhibition.Int J Psychophysiol. 2017 May;115:125-132. doi: 10.1016/j.ijpsycho.2016.06.001. Epub 2016 Jun 2. Int J Psychophysiol. 2017. PMID: 27264056 Free PMC article.
-
[The effect of age on the genetic correlates of visual evoked potentials in man].Fiziol Zh Im I M Sechenova. 1995 Apr;81(4):109-12. Fiziol Zh Im I M Sechenova. 1995. PMID: 7581571 Russian. No abstract available.
-
The nature of individual differences in EEG parameters during homogeneous visual field in 5- and 6-year-old twins: a pilot study.Clin Neurophysiol. 2009 Aug;120(8):1492-500. doi: 10.1016/j.clinph.2009.05.012. Epub 2009 Jun 25. Clin Neurophysiol. 2009. PMID: 19559647
-
Visual information processing: topography of brain electrical activity.Biol Psychol. 1995 May;40(1-2):1-15. doi: 10.1016/0301-0511(95)05111-2. Biol Psychol. 1995. PMID: 7647172 Review.
Cited by
-
Genetic psychophysiology: advances, problems, and future directions.Int J Psychophysiol. 2014 Aug;93(2):173-97. doi: 10.1016/j.ijpsycho.2014.04.003. Epub 2014 Apr 13. Int J Psychophysiol. 2014. PMID: 24739435 Free PMC article. Review.
-
Event-related potential and time-frequency endophenotypes for schizophrenia and psychotic bipolar disorder.Biol Psychiatry. 2015 Jan 15;77(2):127-36. doi: 10.1016/j.biopsych.2014.03.032. Epub 2014 May 4. Biol Psychiatry. 2015. PMID: 24923619 Free PMC article.
References
-
- Almasy L, Porjesz B, Blangero J, Chorlian DB, O'Connor SJ, Kuperman S, et al. Heritability of event-related brain potentials in families with a history of alcoholism. Am J Med Genet. 1999;88(4):383–390. - PubMed
-
- Anokhin AP, van Baal GC, van Beijsterveldt CE, de Geus EJ, Grant J, Boomsma DI. Genetic correlation between the P300 event-related brain potential and the EEG power spectrum. Behav Genet. 2001;31(6):545–554. - PubMed
-
- Basar E, Demiralp T, Schurmann M, Basar-Eroglu C, Ademoglu A. Oscillatory brain dynamics, wavelet analysis, and cognition. Brain and Language. 1999;66:146–183. - PubMed
-
- Basar-Eroglu C, Demiralp T, Schurmann M, Basar E. Topological distribution of oddball `P300' responses. Int J Psychophysiol. 2001;39(2–3):213–220. - PubMed
Publication types
MeSH terms
Grants and funding
LinkOut - more resources
Full Text Sources
Other Literature Sources
