. 2013 Jan 10;49(1):186-99.
doi: 10.1016/j.molcel.2012.10.024. Epub 2012 Nov 29.

Calorie restriction and SIRT3 trigger global reprogramming of the mitochondrial protein acetylome

Affiliations

Calorie restriction and SIRT3 trigger global reprogramming of the mitochondrial protein acetylome

Alexander S Hebert et al. Mol Cell. .

Abstract

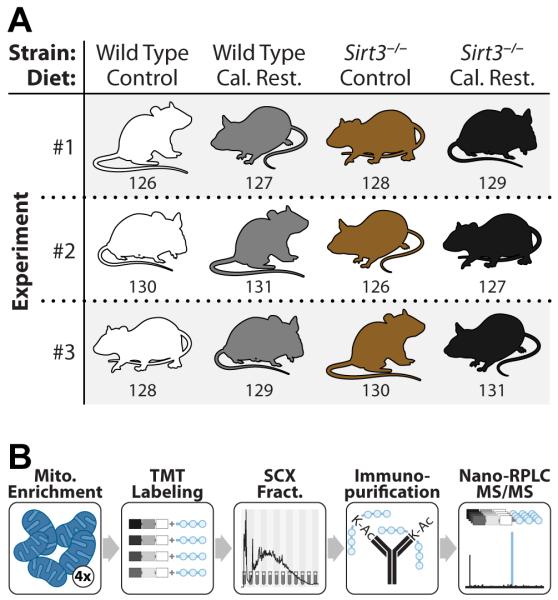
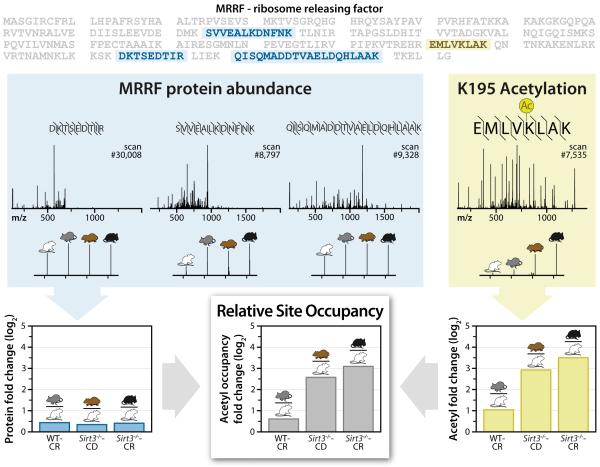
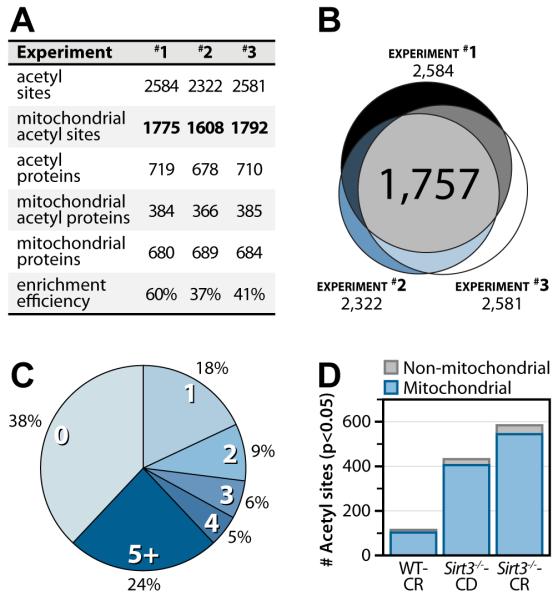
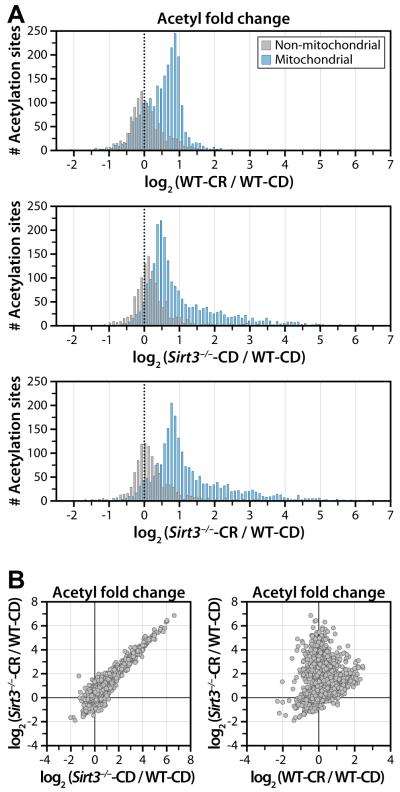
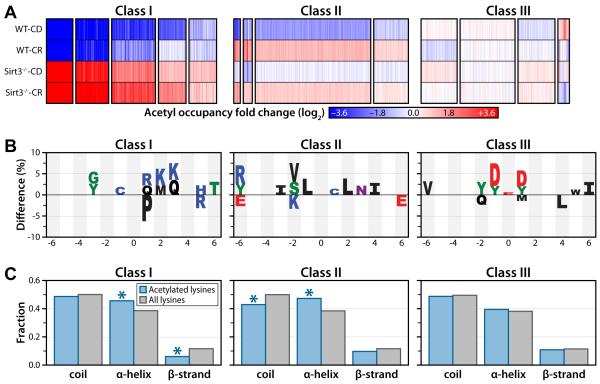
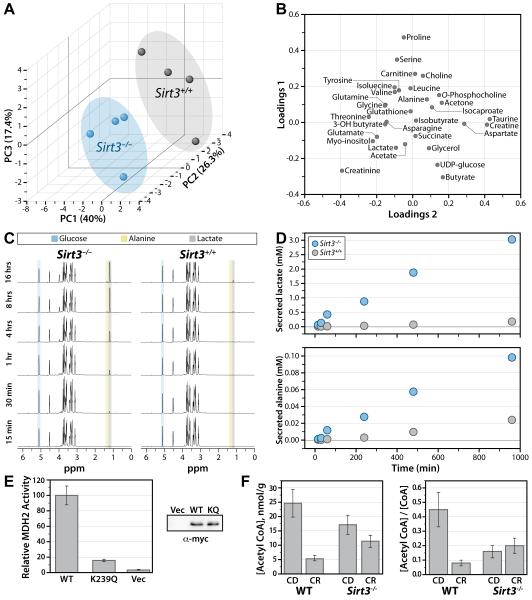
Calorie restriction (CR) extends life span in diverse species. Mitochondria play a key role in CR adaptation; however, the molecular details remain elusive. We developed and applied a quantitative mass spectrometry method to probe the liver mitochondrial acetyl-proteome during CR versus control diet in mice that were wild-type or lacked the protein deacetylase SIRT3. Quantification of 3,285 acetylation sites-2,193 from mitochondrial proteins-rendered a comprehensive atlas of the acetyl-proteome and enabled global site-specific, relative acetyl occupancy measurements between all four experimental conditions. Bioinformatic and biochemical analyses provided additional support for the effects of specific acetylation on mitochondrial protein function. Our results (1) reveal widespread reprogramming of mitochondrial protein acetylation in response to CR and SIRT3, (2) identify three biochemically distinct classes of acetylation sites, and (3) provide evidence that SIRT3 is a prominent regulator in CR adaptation by coordinately deacetylating proteins involved in diverse pathways of metabolism and mitochondrial maintenance.


Figures

Figure 1
Figure 1. Experimental design and mass spectrometry workflow for quantitation of acetylated mitochondrial proteins between four biological conditions
(A) WT and Sirt3−/− mouse liver mitochondria were compared in biological triplicate from mice fed either the control or calorie restricted (CR) diet. Numbers correspond to the isobaric mass tag used for that sample. (B) Extracted protein from purified liver mitochondria was trypsin digested followed by labeling with TMT reagents. Labeled peptides were combined and fractionated by strong cation exchange chromatography. Each fraction was enriched for acetyl peptides with a pan anti-acetyl lysine antibody and analyzed via nano-RPLC-MS/MS. See also Figure S3.
Figure 2
Figure 2. Example acetyl occupancy quantitation (relative), for site K195 on the MRRF protein. The peptides used for calculations are highlighted within the MRRF protein sequence
Blue: Un-modified peptide sequences, spectra with reporter ion magnification and protein fold change for each condition compared to WT-CD condition. Note, the three unique peptides from five total identifications are shown here. Yellow: The MRRF K195 acetylated peptide sequence, spectra, and acetyl fold change for each condition compared to WT-CD. Bottom center: Results for acetyl fold change normalized to protein fold change for each condition compared to WT-CD. See also Figure S1.
Figure 3
Figure 3. Acetylomic experimental results and metrics
(A) Experimental metrics for each experiment. Enrichment efficiency is calculated as the ratio of acetyl peptide spectral matches to the total number of peptide spectral matches for enriched samples. (B) Venn diagram indicating overlap of the acetyl sites quantified in each experiment. Experimental overlap of acetyl sites identified in three biological replicates yields 1,757 quantifiable acetylation sites. (C) Pie chart of the number of acetylation sites detected per mitochondrial protein. (D) Number of acetyl sites significantly changing ≥ 2-fold for each condition compared to WT control diet (p < 0.05, Welch’s t-test with Storey Correction). See also Tables S1 and S2.
Figure 4
Figure 4. Quantitative distribution of acetyl site data and scatterplot analysis reveals distinct populations
(A) Bimodal distribution of acetyl sites quantified (n=3) segregates between mitochondrial (blue) and non-mitochondrial (gray) proteins. Mitochondrial acetyl sites exhibit increased acetylation, while non-mitochondrial acetyl sites show minimal change. (Top plot) Analysis of acetyl sites for WT-CR vs. WT-CD indicates CR alters mitochondrial protein acetylation. (Middle and lower plots) Analysis of acetyl sites for Sirt3−/−-CD/CR vs WT-CD indicates that loss of SIRT3 dominates the acetylation content of mitochondrial proteins with increased acetylation apparent in Sirt3−/− under both CD and CR. (B) Scatter plot (Top) of acetyl fold change between Sirt3−/−-CR and Sirt3−/−-CD, displays near-linear correlation and indicates SIRT3 expression dominates global acetylation status of the mitochondrial proteome. (Lower plot) Scatter plot comparison of the acetyl fold change of Sirt3−/−-CR to WT-CR exposes unique populations of acetyl sites. See also Figure S2.
Figure 5
Figure 5. Cluster analysis resolves acetyl sites into three distinct classes
(A) Cluster analysis identified 15 clusters, with 13 grouped into 3 classes based on their overall trends between the four biological conditions: Class I - Acetylation sites that respond dynamically to SIRT3 expression. Class II - Acetylation sites that are largely independent of SIRT3 expression but respond to CR. Class III - Acetylation sites that display minimal perturbation in response to either loss of SIRT3 expression or CR. Each column represents a quantified acetyl site. Blue: decreased acetyl occupancy, White: no change, Red: increased acetyl occupancy. (B) Amino acid motifs identified for clusters displaying the largest magnitude fold change for each class (from A). The motif shows significant (p < 0.05) under or over representation of a particular amino acid at each site flanking the acetylated lysine (position 0). (C) Predicted protein secondary structures of acetylation sites identified in each class. Probabilities for coil, α-helix and β-strands were compared with the probabilities of these secondary structure elements in all lysines identified in the study. (Class I α-helix: p < 3.0 × 10⁻³; Class I β-strand: p < 2.0 × 10⁻⁴; Class II coil: p < 8.0 × 10⁻⁴; Class II α-helix: p < 2.5 × 10⁻⁵, hyper-geometric analysis).
Figure 6
Figure 6. Functional validation of SIRT3 in mitochondrial metabolism
(A-D) NMR-metabolomics analysis of Sirt3+/+ and Sirt3−/− MEFs. (A) PCA analysis 3-D score plot for the first 3 principal components (PC) with corresponding contribution percentage for each PC. PCA segregates Sirt3+/+ and Sirt3−/− MEFs. (B) Metabolites contributing to the segregation of Sirt3+/+ and Sirt3−/− MEFs are identified in the loading plot for PC1 and PC2. Metabolites localized further from the origin (0,0) have a greater contribution to the segregation of Sirt3+/+ and Sirt3−/−. (C) 13C-edited 1H-NMR spectra of metabolites secreted into the media. 13C-Glucose, 13C-lactate and 13C-alanine peaks are identified. (D) Time-dependent increases in 13C-lactate (top plot) and 13C-alanine (bottom plot) concentrations relative to glucose concentration. (E) Acetyl CoA concentration (left) from mouse liver tissue (one per biological condition) displayed as nmol/g wet weight of tissue and acetyl CoA / CoA ratio (right). Error bars represent percent error calculated from isotopic acetyl CoA standard. (F) MDH2 activity is reduced by K239 acetyl mimic. Rates are calculated relative to WT, error bars represent standard deviation (n = 3, n=2 for Vector control). See also Figure S6, Table S3.

References

    1. Anderson RM, Weindruch R. The caloric restriction paradigm: implications for healthy human aging. Am J Hum Biol. 2012;24:101–106. - PMC - PubMed
    1. Bathe OF, Shaykhutdinov R, Kopciuk K, Weljie AM, McKay A, Sutherland FR, Dixon E, Dunse N, Sotiropoulos D, Vogel HJ. Feasibility of identifying pancreatic cancer based on serum metabolomics. Cancer Epidemiol Biomarkers Prev. 2011;20:140–147. - PubMed
    1. Campbell CT, Kolesar JE, Kaufman BA. Mitochondrial transcription factor A regulates mitochondrial transcription initiation, DNA packaging, and genome copy number. Biochim Biophys Acta. 2012 - PubMed
    1. Chen Y, Zhao W, Yang JS, Cheng Z, Luo H, Lu Z, Tan M, Gu W, Zhao Y. Quantitative acetylome analysis reveals the roles of SIRT1 in regulating diverse substrates and cellular pathways. Mol Cell Proteomics. 2012 - PMC - PubMed
    1. Choudhary C, Kumar C, Gnad F, Nielsen ML, Rehman M, Walther TC, Olsen JV, Mann M. Lysine acetylation targets protein complexes and co-regulates major cellular functions. Science. 2009;325:834–840. - PubMed

Publication types

MeSH terms