. 2012 Dec 11;22(6):737-50.
doi: 10.1016/j.ccr.2012.10.025. Epub 2012 Nov 29.

Identification of Sox9-dependent acinar-to-ductal reprogramming as the principal mechanism for initiation of pancreatic ductal adenocarcinoma

Affiliations

Identification of Sox9-dependent acinar-to-ductal reprogramming as the principal mechanism for initiation of pancreatic ductal adenocarcinoma

Janel L Kopp et al. Cancer Cell. .

Abstract

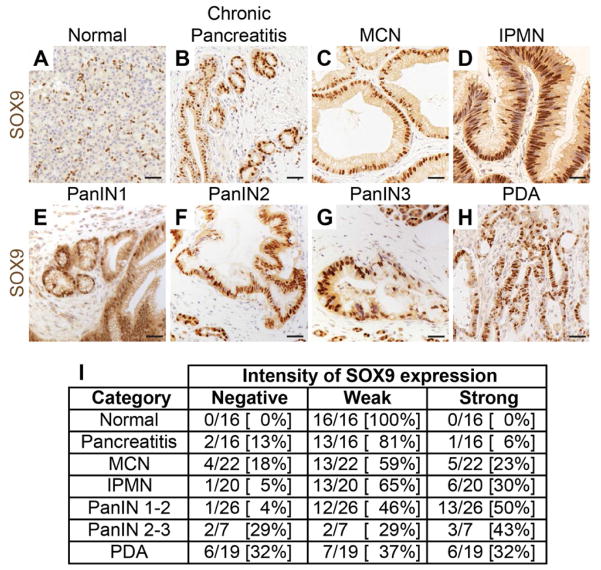
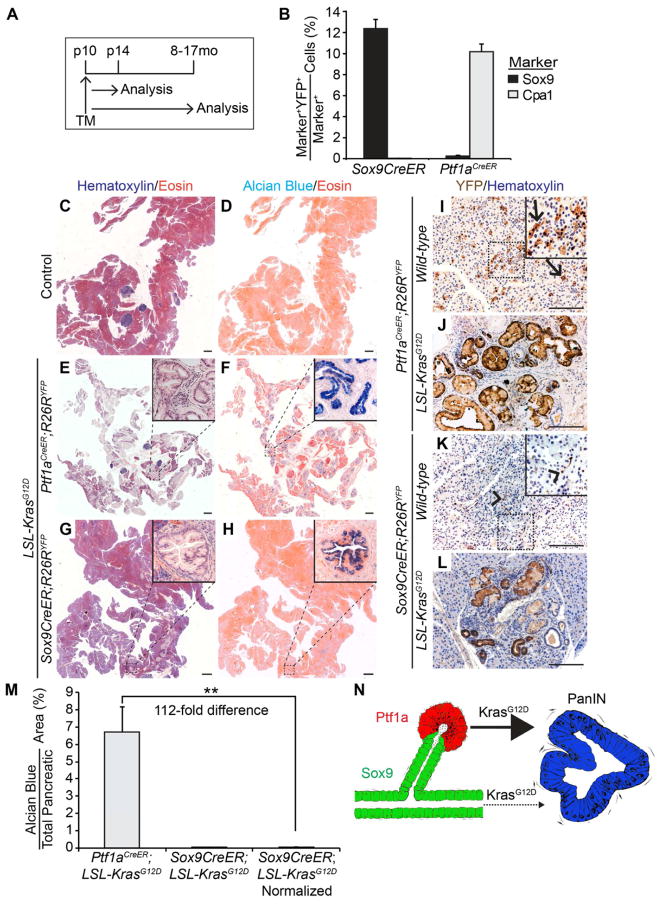
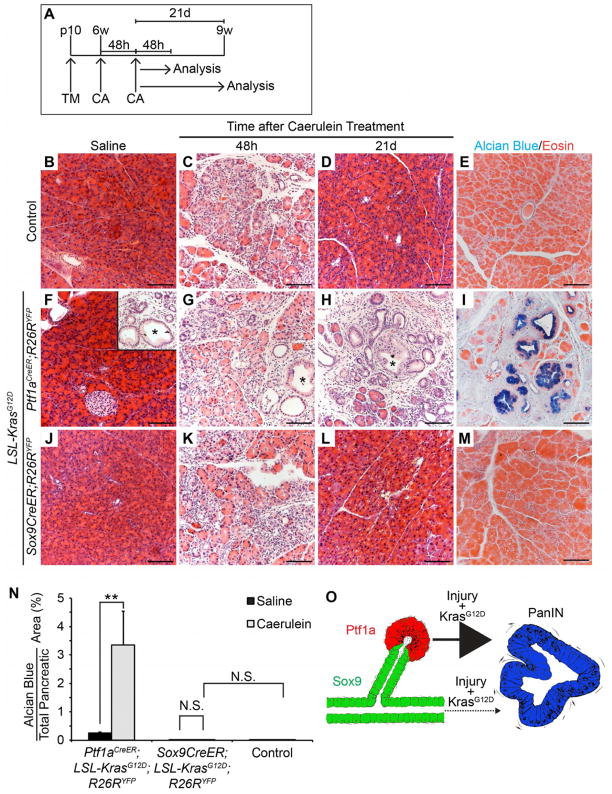
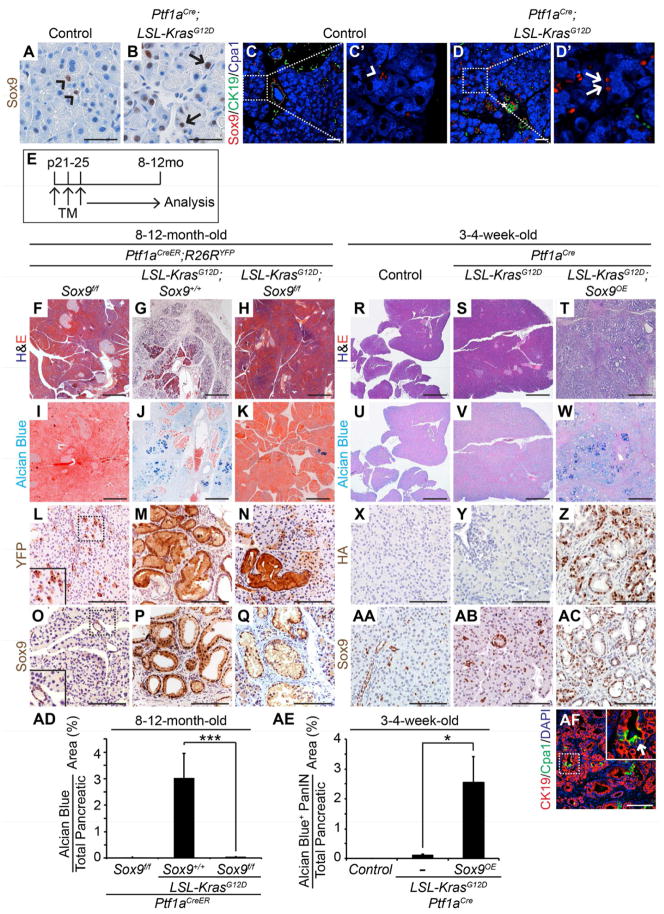
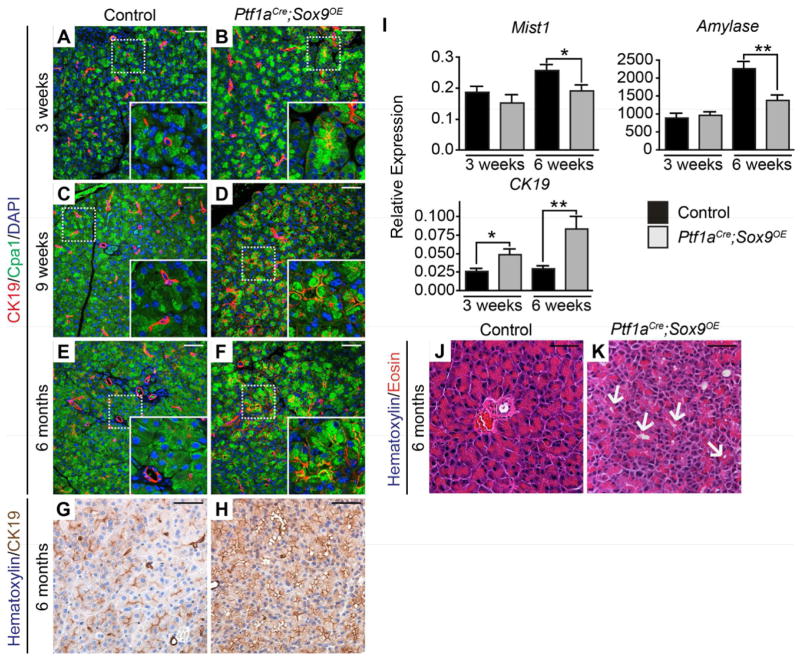
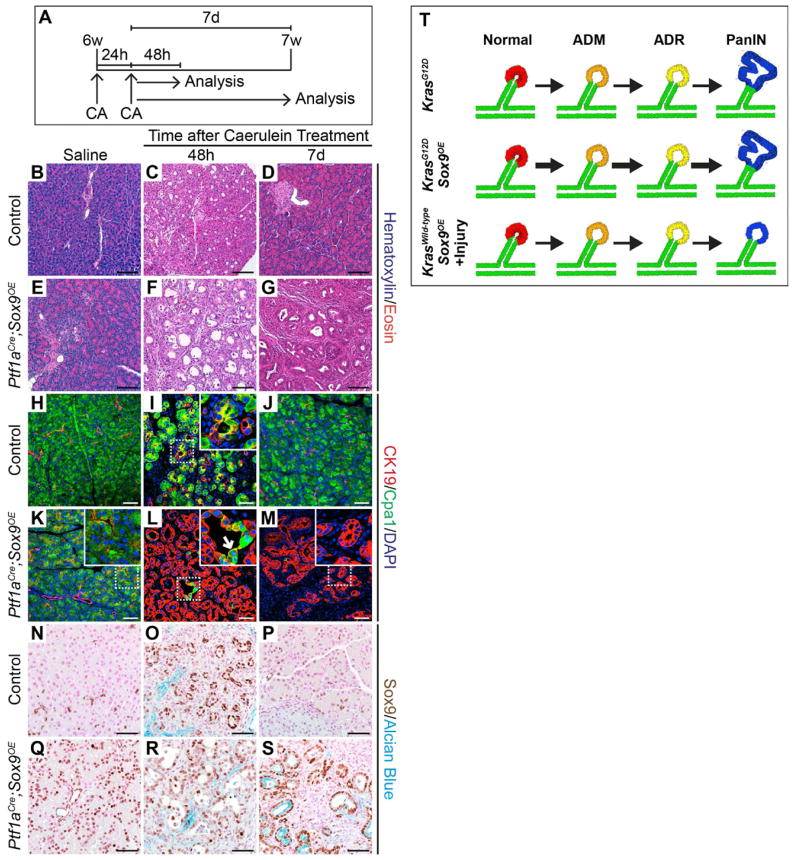
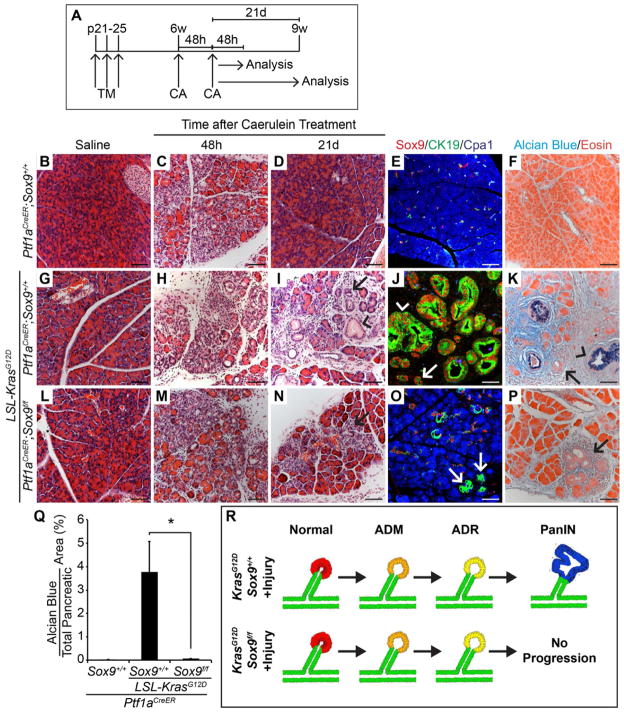
Tumors are largely classified by histologic appearance, yet morphologic features do not necessarily predict cellular origin. To determine the origin of pancreatic ductal adenocarcinoma (PDA), we labeled and traced pancreatic cell populations after induction of a PDA-initiating Kras mutation. Our studies reveal that ductal and stem-like centroacinar cells are surprisingly refractory to oncogenic transformation, whereas acinar cells readily form PDA precursor lesions with ductal features. We show that formation of acinar-derived premalignant lesions depends on ectopic induction of the ductal gene Sox9. Moreover, when concomitantly expressed with oncogenic Kras, Sox9 accelerates formation of premalignant lesions. These results provide insight into the cellular origin of PDA and suggest that its precursors arise via induction of a duct-like state in acinar cells.


Conflict of interest statement

The authors have no conflicts of interest.

Figures

Figure 1
Figure 1. SOX9 is expressed in human premalignant and malignant pancreatic lesions
(AH) Immunohistochemistry for SOX9 and hematoxylin counterstain on a tissue microarray spotted with human pancreatic tissue cores. Representative images showing SOX9 expression in normal pancreatic ducts (A), chronic pancreatitis (B), mucinous cystic neoplasms (MCN) (C), intraductal papillary mucinous neoplasms (IPMN) (D), pancreatic intraepithelial neoplasia 1 (PanIN1) (E), PanIN2 (F), PanIN3 (G), and pancreatic ductal adenocarcinoma (PDA) (H). (I) Number of tissue cores within each phenotypic category displaying no, weak, or strong SOX9 staining intensity. Scale bars: 100μm.
Figure 2
Figure 2. KrasG12D expression in acinar, but not in ductal/centroacinar cells, readily induces PanIN formation
(A) Sox9CreER;R26RYFP and Ptf1aCreER;R26RYFP mice were injected once with tamoxifen (TM) at postnatal day (p) 10 and analyzed at p14 or at 8 to 17 months (mo) of age. (B) Quantification of Sox9+ or Cpa1+ cells expressing YFP at p14 (n=4). H&E (C, E, G) or Alcian blue and eosin (D, F, H) staining of pancreatic sections from 8–17-month-old control (C, D), Ptf1aCreER;LSL-KrasG12D;R26RYFP (E, F), or Sox9CreER;LSL-KrasG12D;R26RYFP (G, H) mice reveals abundant Alcian blue+ PanINs only in Ptf1aCreER;LSL-KrasG12D;R26RYFP mice. (IL) Immunohistochemistry of YFP in 8–17-month-old mice shows expression of YFP in acinar cells in Ptf1aCreER;R26RYFP mice (I, arrows) and ductal/centroacinar cells (CACs) in Sox9CreER;R26RYFP mice (K, arrowheads). PanINs in Ptf1aCreER;LSL-KrasG12D;R26RYFP (J) and Sox9CreER;LSL-KrasG12D;R26RYFP (L) mice are YFP+, indicating an acinar or ductal/CAC origin, respectively. (M) Quantification of Alcian blue+ pancreatic area in 8–17-month-old mice (n=9 in Ptf1aCreER;LSL-KrasG12D mice; n=6 in Sox9CreER;LSL-KrasG12D mice). The Alcian blue+ area in Sox9CreER;LSL-KrasG12D;R26RYFP mice was multiplied by 4.6 (normalized) to account for the greater total number of recombined cells in Ptf1aCreER;R26RYFP mice (see Figure S1L). (N) Schematic showing the predominantly acinar origin of PanINs after expression of oncogenic Kras. Values are shown as mean ± s.e.m. **P<0.01. Scale bars: 1 mm (C–H) and 100μm (I–L). See also Figure S1.
Figure 3
Figure 3. Acute pancreatitis promotes PanIN formation from KrasG12D-expressing acinar cells, but not ductal/centroacinar cells
(A) Ptf1aCreER;LSL-KrasG12D;R26RYFP, Sox9CreER;LSL-KrasG12D;R26RYFP and control mice were injected once with tamoxifen (TM) at postnatal day (p) 10. At 6 weeks (w) of age, mice were treated with two sets of caerulein (CA) or saline injections on alternating days and analyzed 48 hours (h) or 21 days (d) later. (B–D, F–H, J–L) H&E staining reveals occasional PanINs in 9-week-old Ptf1aCreER;LSL-KrasG12D;R26RYFP mice (F, inset) and persistent ADM and PanINs 21d after CA (H), but normal pancreas morphology in Sox9CreER;LSL-KrasG12D;R26RYFP and control mice (D, L). Asterisks denote PanINs. (E, I, M) Alcian blue and eosin staining of pancreatic sections from mice 21d after CA treatment. (N) Quantification of Alcian blue+ pancreatic area reveals a significant increase in PanINs after CA in Ptf1aCreER;LSL-KrasG12D;R26RYFP (n=4), but not in Sox9CreER;LSL-KrasG12D;R26RYFP mice (n=5). (O) Schematic showing that pancreatic injury promotes PanIN formation from KrasG12D-expressing acinar, but not ductal/centroacinar cells. N.S., not significant. Values are shown as mean ± s.e.m. **P<0.01. Scale bars: 100μm. See also Figure S2.
Figure 4
Figure 4. Sox9 is necessary for and accelerates KrasG12D-induced PanIN formation
(A, B) Immunohistochemistry shows Sox9 expression in ductal/centroacinar (CAC) (A, arrowheads), but not acinar cells in control mice. In 2-month-old Ptf1aCre;LSL-KrasG12D mice, Sox9 is also detected in some acinar cells (B, arrows). (C–D) Co-immunofluorescence staining for Sox9, CK19 and Cpa1 confirms Sox9 expression in ductal/CACs (C′, arrowhead points to CAC) in control mice and shows Sox9+Cpa1+CK19 acinar cells in Ptf1aCre;LSL-KrasG12D mice (D′, arrowheads). (E–Q) Tamoxifen (TM) was administered to Ptf1aCreER;Sox9f/f;R26RYFP, Ptf1aCreER;LSL-KrasG12D;Sox9+/+;R26RYFP and Ptf1aCreER;LSL-KrasG12D;Sox9f/f;R26RYFP mice at postnatal day (p) 21, 23 and 25 to simultaneously ablate Sox9 and induce KrasG12D in acinar cells. Mice were analyzed at 812 months (mo) of age. H&E (F–H) and Alcian blue staining (I–K) shows almost no PanINs after Sox9 deletion. (L–Q) Immunohistochemistry reveals expression of YFP in PanINs in both Ptf1aCreER;KrasG12D;Sox9+/+;R26RYFP and Ptf1aCreER;LSL-KrasG12D;Sox9f/f;R26RYFP mice (M, N). Sox9 expression in PanINs in the Sox9f/f background indicates lack of Sox9f recombination (Q). H&E (R–T) and Alcian blue staining (U–W) reveals abundant ADM and PanINs in Ptf1aCre;LSL-KrasG12D;Sox9OE, but not in Ptf1aCre;LSL-KrasG12D or control mice at 3–4 weeks of age. Immunohistochemistry for HA (X–Z) and Sox9 (AA–AC) shows Sox9+ PanINs originating from cells that recombined the Sox9OE transgene. (AD, AE) Quantification of Alcian blue+ pancreatic area reveals a significant reduction of PanINs after Sox9 deletion (n=9) and conversely, an increase after Sox9 misexpression (n=5). (AF) Immunofluorescence staining shows abundant CK19 and little Cpa1 expression in 4-week-old Ptf1aCre;LSL-KrasG12D;Sox9OE mice. Arrow points to CK19+Cpa1+ cell. Values are shown as mean ± s.e.m. *P<0.05 and ***P<0.001. Scale bars: 25μm (A–B), 50 μm (C, D), 100 μm (L–Q, X–AC, AF), and 500μm (F–K, R–W). See also Figure S3.
Figure 5
Figure 5. Sox9 misexpression induces ductal genes
(A–F) Co-immunofluorescence staining for Cpa1 and CK19 shows CK19+Cpa+ cells in Ptf1aCre;Sox9OE mice (B, D, F), but not in controls (A, C, E). (G–H) Immunohistochemistry for CK19 reveals greater staining intensity in 6-month-old Ptf1aCre;Sox9OE than in control mice. (I) QRT-PCR analysis of Mist1, amylase and CK19 in whole pancreas RNA from Ptf1aCre;Sox9OE and control mice (n=5). (J, K) H&E staining shows acinar clusters with dilated lumens in 6-month-old Ptf1aCre;Sox9OE mice (K, arrows). Values are shown as mean ± s.e.m. *P<0.05 and **P<0.01. Scale bars: 50μm.
Figure 6
Figure 6. Sox9 promotes persistent acinar-to-ductal reprogramming (ADR) and formation of mucinous metaplastic lesions after acute pancreatitis
(A) Six-week-old Ptf1aCre;Sox9OE and control mice were treated with two sets of caerulein (CA) or saline injections on consecutive days and analyzed 48 hours (h) or 7 days (d) later. Saline-treated mice were analyzed at 21d. (B–G) H&E staining reveals persistent acinar-to-ductal metaplasia (ADM) in Ptf1aCre;Sox9OE mice (G). (H–M) Co-immunofluorescence staining for CK19 and Cpa1 shows a few CK19+Cpa1+ (L, arrow) 48h after CA and mainly CK19+Cpa1 cells after 7d (M) in Ptf1aCre;Sox9OE mice. (N–S) Immunohistochemistry for Sox9 and Alcian blue staining shows Sox9+Alcian blue+ mucinous metaplastic lesions in Ptf1aCre;Sox9OE mice (S) but not in control mice (P) 7d after CA. (T) Schematic summarizing the phenotypes of Sox9 misexpressing mice in the presence and absence of KrasG12D or acute pancreatitis. w, weeks. Scale bars: 100μm (B–G) and 50μm (H–S). See also Figure S4.
Figure 7
Figure 7. Sox9-deficient acinar cells expressing KrasG12D can undergo persistent acinar-to-ductal reprogramming (ADR) after acute pancreatitis, but do not progress into PanINs
(A) Ptf1aCreER;Sox9+/+, Ptf1aCreER;LSL-KrasG12D;Sox9+/+ and Ptf1aCreER;LSL-KrasG12D;Sox9f/f mice were injected with tamoxifen (TM) at postnatal day (p) 21, 23 and 25. At 6 weeks (w) of age, mice were treated with two sets of caerulein (CA) or saline injections on alternating days and analyzed 48 hours (h) or 21 days (d) later. (B–D, G–I, L–N) H&E staining shows persistent acinar-to-ductal metaplasia (ADM) in Ptf1aCreER;LSL-KrasG12D;Sox9+/+ and to a lesser extent also in Ptf1aCreER;LSL-KrasG12D;Sox9f/f mice (I, N, arrows). PanINs are only present in Ptf1aCreER;LSL-KrasG12D;Sox9+/+ mice (I, arrowhead). (E, J, O) Co-immunofluorescence staining for CK19, Cpa1 and Sox9 reveals CK19+Cpa1 duct-like cell clusters in Ptf1aCreER;LSL-KrasG12D mice in the presence and absence of Sox9 (J, O, arrows). (F, K, P) Alcian blue and eosin staining shows PanINs in Ptf1aCreER;LSL-KrasG12D;Sox9+/+ mice (K), but not in Ptf1aCreER;LSL-KrasG12D;Sox9f/f mice (P). Arrows in K, P point to ADM and arrowheads in J, K to PanINs. (Q) Quantification of Alcian blue+ pancreatic area 21d after CA (n=4–5). (R) Schematic summarizing the phenotype observed in Sox9 loss-of-function experiments in the presence of KrasG12D and acute pancreatitis. Values are shown as mean ± s.e.m. *P<0.05. Scale bars: 50μm. See also Figure S5.

Comment in

References

    1. Aguirre AJ, Bardeesy N, Sinha M, Lopez L, Tuveson DA, Horner J, Redston MS, DePinho RA. Activated Kras and Ink4a/Arf deficiency cooperate to produce metastatic pancreatic ductal adenocarcinoma. Genes Dev. 2003;17:3112–3126. - PMC - PubMed
    1. Ardito CM, Gruner BM, Takeuchi KK, Lubeseder-Martellato C, Teichmann N, Mazur PK, Delgiorno KE, Carpenter ES, Halbrook CJ, Hall JC, et al. EGF Receptor Is Required for KRAS-Induced Pancreatic Tumorigenesis. Cancer Cell. 2012;22:304–317. - PMC - PubMed
    1. Bien-Willner GA, Stankiewicz P, Lupski JR. SOX9cre1, a cis-acting regulatory element located 1.1 Mb upstream of SOX9, mediates its enhancement through the SHH pathway. Hum Mol Genet. 2007;16:1143–1156. - PubMed
    1. Brembeck FH, Schreiber FS, Deramaudt TB, Craig L, Rhoades B, Swain G, Grippo P, Stoffers DA, Silberg DG, Rustgi AK. The mutant K-ras oncogene causes pancreatic periductal lymphocytic infiltration and gastric mucous neck cell hyperplasia in transgenic mice. Cancer Res. 2003;63:2005–2009. - PubMed
    1. Carriere C, Seeley ES, Goetze T, Longnecker DS, Korc M. The Nestin progenitor lineage is the compartment of origin for pancreatic intraepithelial neoplasia. Proc Natl Acad Sci U S A. 2007;104:4437–4442. - PMC - PubMed

Publication types

MeSH terms