. 2012 Dec 11;22(6):725-36.
doi: 10.1016/j.ccr.2012.09.022. Epub 2012 Nov 29.

Spatiotemporal regulation of epithelial-mesenchymal transition is essential for squamous cell carcinoma metastasis

Affiliations

Spatiotemporal regulation of epithelial-mesenchymal transition is essential for squamous cell carcinoma metastasis

Jeff H Tsai et al. Cancer Cell. .

Abstract

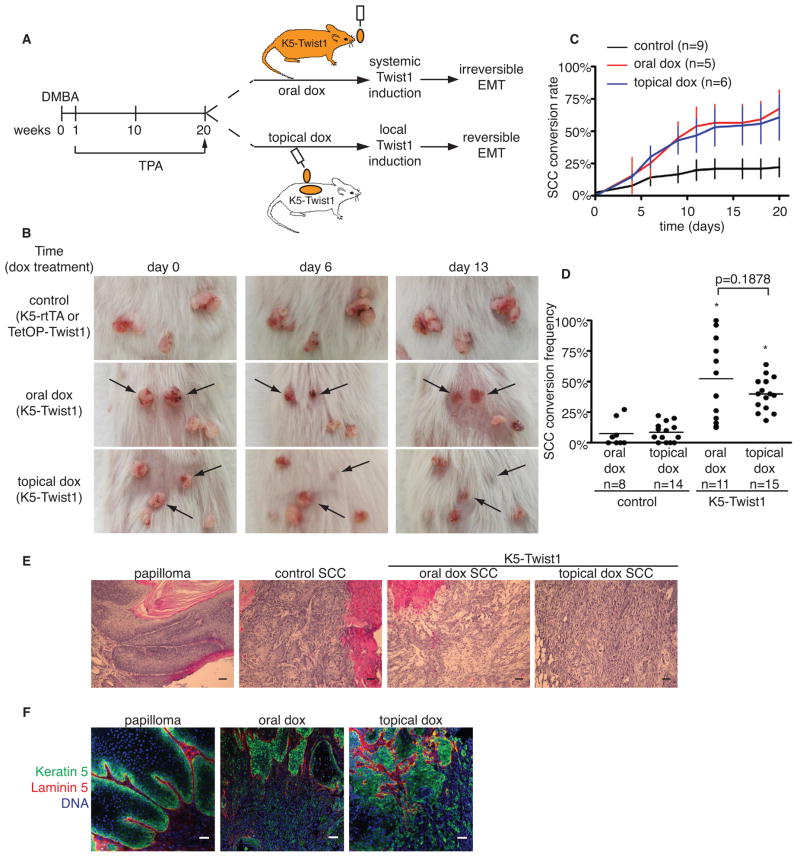
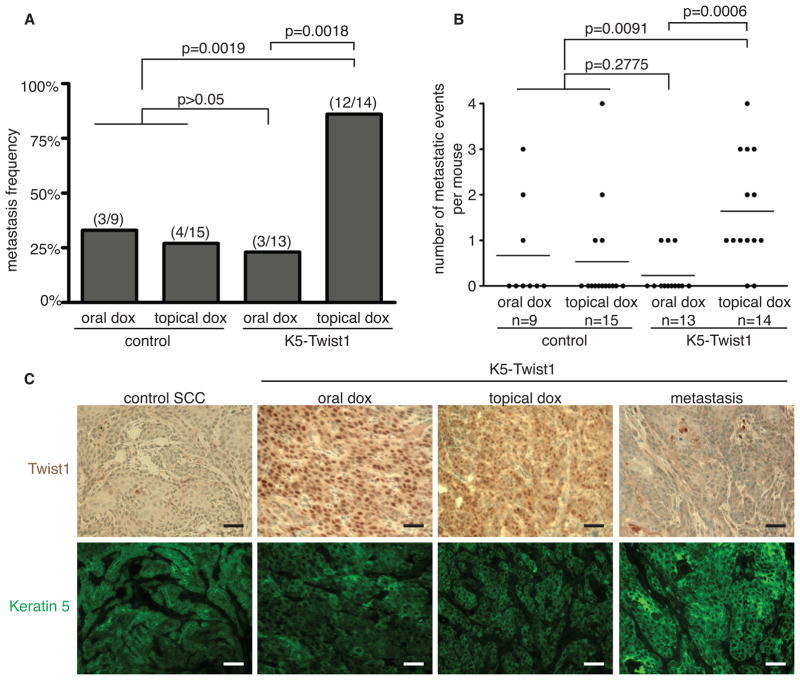
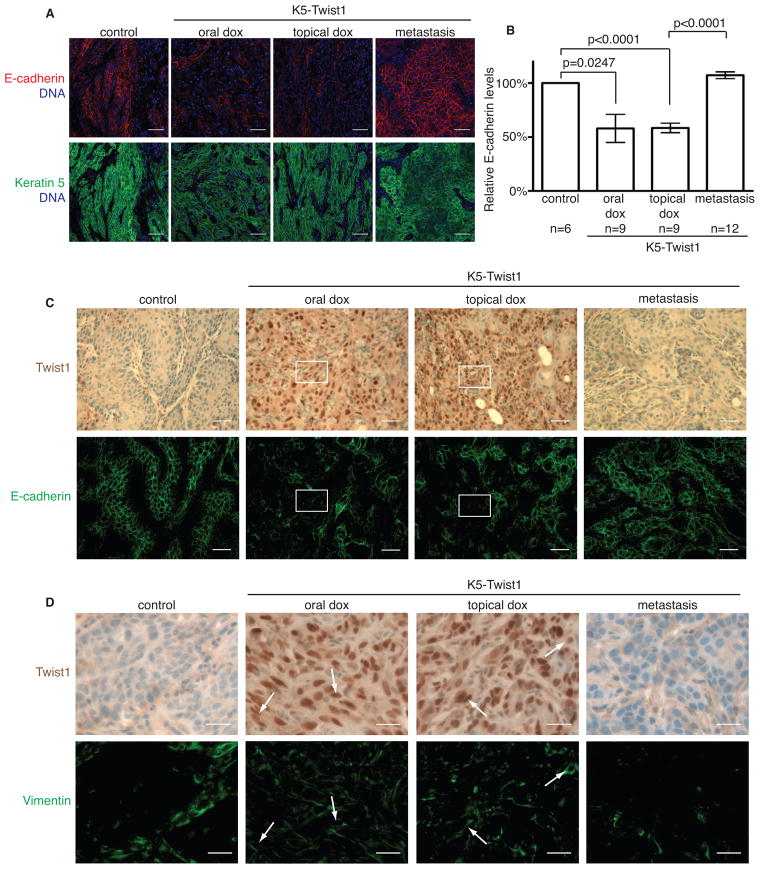
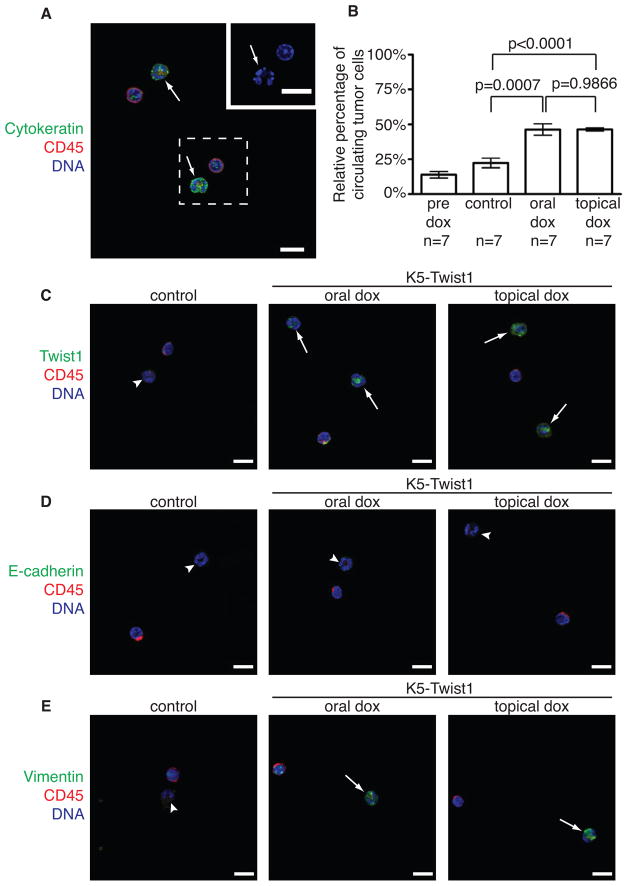
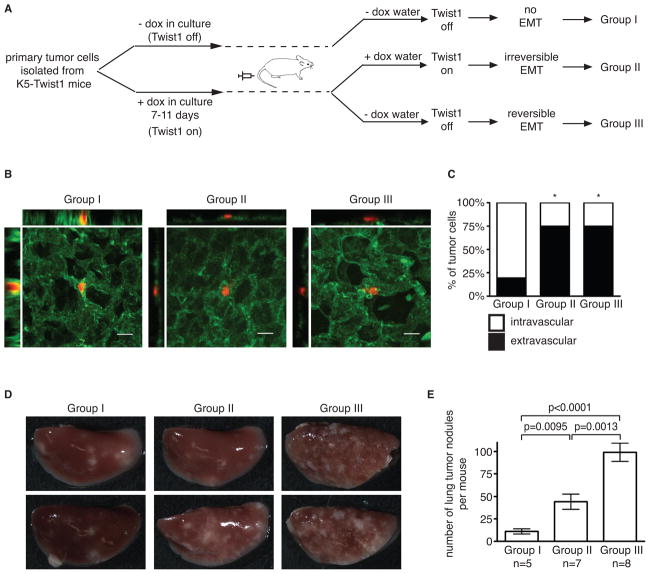
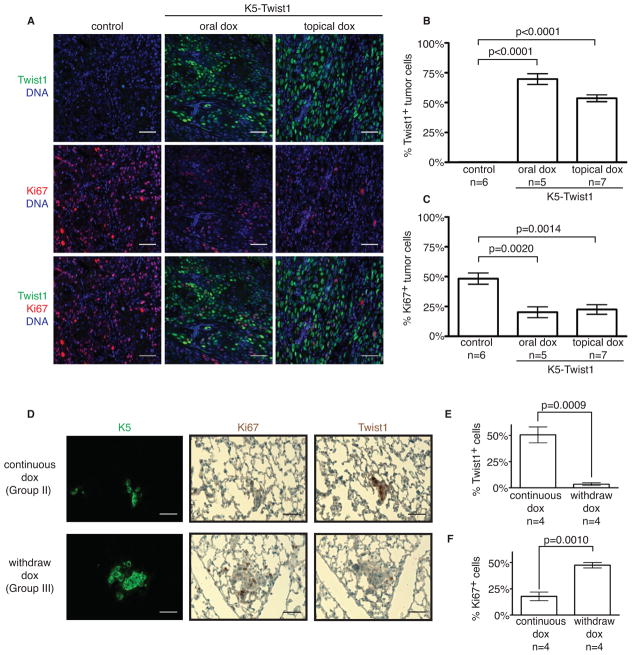
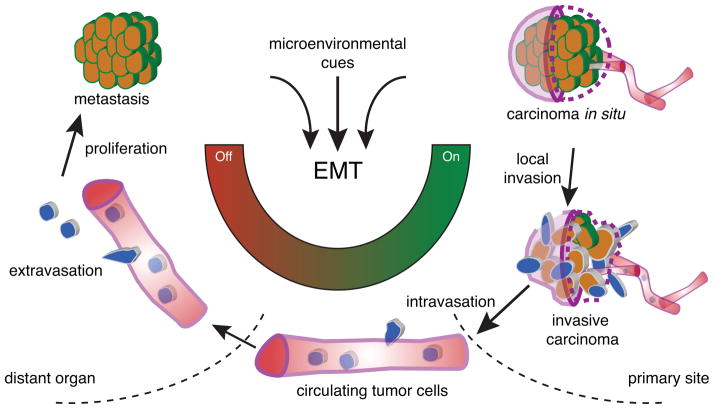
Epithelial-mesenchymal transition (EMT) is implicated in converting stationary epithelial tumor cells into motile mesenchymal cells during metastasis. However, the involvement of EMT in metastasis is still controversial, due to the lack of a mesenchymal phenotype in human carcinoma metastases. Using a spontaneous squamous cell carcinoma mouse model, we show that activation of the EMT-inducing transcription factor Twist1 is sufficient to promote carcinoma cells to undergo EMT and disseminate into blood circulation. Importantly, in distant sites, turning off Twist1 to allow reversion of EMT is essential for disseminated tumor cells to proliferate and form metastases. Our study demonstrates in vivo the requirement of "reversible EMT" in tumor metastasis and may resolve the controversy on the importance of EMT in carcinoma metastasis.


Figures

Figure 1
Figure 1. Induction of Twist1 promotes invasive carcinoma conversion
(A) A schematic of the DMBA/TPA skin tumor model and two doxycycline (dox) induction approaches in K5-Twist1 mice. (B) Representative images of tumor lesions in control and doxycycline-treated K5-Twist1 mice over time. Control mice are single transgene littermates that received oral or topical doxycycline. (C) Graph of conversion rates from papillomas to SCCs over time for a representative cohort ± standard error of mean (SEM) at each time point. (D) Scatter plot of SCC conversion frequency in control and doxycycline-treated K5-Twist1 mice. Each dot represents one mouse, and the bar represents the mean of each group. * p<0.0001 compared to control group, Student’s t test. (E) Histologic sections of tumors stained with hematoxylin and eosin (H&E). Papillomas have well-defined cellular organization, whereas control SCCs are well- to moderately-differentiated. In contrast, doxycycline-treated tumors are disorganized and poorly-differentiated. Bar=50μm. (F) Frozen tumor sections were co-stained for tumor cells (K5, green), basement membrane (laminin 5, red), and nuclei stain (blue) to examine the breachment of basement membrane by tumor cells. Bar=50μm. See also Figure S1
Figure 2
Figure 2. Reversible induction of Twist1 promotes carcinoma metastasis
(A) A histogram showing metastasis frequencies in control and K5-Twist1 mice group receiving oral or topical doxycycline. The fraction of mice developing metastases in individual groups is represented above each bar. Fisher’s exact test analysis was performed to determine statistical significance. (B) An event was defined as a tumor nodule in an individual lymph node and/or the presence of at least a single nodule in the lung tissue. Each dot represents a single mouse. Student’s t test statistical analysis was performed to compare average events per group. (C) Representative images of tumor sections co-stained for Twist1 (brown) and K5 (green). Paraffin-embedded tumor sections were stained for Twist1 using immunohistochemistry (IHC, brown) followed by immunofluorescent (IF) staining for keratin 5 (K5, green) on the same section to identify tumor cells. Bar=50μm.
Figure 3
Figure 3. Twist1 regulates EMT in a reversible fashion during metastasis
(A) Primary and metastatic tumor samples were co-stained for E-cadherin (red) and K5 (green) to identify tumor cells undergoing EMT. Bar=50μm. (B) The relative E-cadherin levels in K5+ tumor cells were quantified in individual tumor samples from (A). Values were normalized to control samples and plotted on a histogram ± SEM. Student’s t test statistical analysis was performed. (C) Representative images of tumor sections from control and K5-Twist1 mice co-stained for Twist1 (brown) and E-cadherin (green) expression. Boxed regions highlight areas of Twist1-positive tumor cells with disrupted or absent E-cadherin expression. Bar=50μm. (D) Representative images of tumor sections from control and K5-Twist1 mice co-stained for Twist1 (brown) and vimentin (green) expression. Arrows indicate Twist1-positive tumor cells that express vimentin. Bar=25μm. See also Figure S2
Figure 4
Figure 4. Activation of EMT promotes tumor cell intravasation
(A) Representative image of circulating tumor cells (CTCs). CTCs are defined as cells that are CD45 (red) and CK+ (green) and present irregular nuclear shape (arrows). Inset shows magnified irregular nucleus in CTC. Bar=10μm. (B) Quantification of CTCs in K5-Twist1 mice prior to doxycycline treatment (pre dox), in control mice and K5-Twist1 mice receiving oral and topical doxycycline. The percentages of CTCs among all nucleated cells were plotted on a histogram ± SEM. Student’s t test statistical analysis was performed. (C) CTCs from control and doxycycline-treated K5-Twist1 mice were examined for Twist1 expression. Representative images of CTCs co-stained for Twist1 (green), CD45 (red), and nuclei (blue). Arrows represent CTCs that are Twist1-positive, arrowheads represent CTCs that are Twist1-negative. Bar=10μm. (D) Representative images of CTCs co-stained for E-cadherin (green), CD45 (red), and nuclei (blue). Arrowheads represent CTCs that are E-cadherin-negative. All CTCs show no E-cadherin expression. Bar=10μm. (E) Representative images of CTCs stained for vimentin (green), CD45 (red), and nuclei (blue). Arrows represent CTCs that are vimentin-positive, arrowheads represent CTCs in the control littermates that are vimentin-negative. Bar=10μm. See also Figure S3
Figure 5
Figure 5. Activation of EMT promotes tumor cell extravasation
(A) A schematic of the experimental lung metastasis design. (B) Confocal images of tumor cell (red) extravasation from lung vasculature (green). Bar=20μm. (C) Quantification of tumor cell extravasation at 36 hours post tail vein injection. The number of tumor cells inside or outside of the vasculature was counted and then divided by the total number of cells assayed (n=28–32 cells per group). The percentage of tumor cells inside (intravascular) or outside (extravascular) of the vessel was plotted on a stacked bar graph. * p<0.0001 as determined by Fisher’s exact test, compared to control group I. (D and E) Images of lung tissues and quantification of average lung nodules per mouse ± SEM 4 weeks after tail vein injection. Student’s t test statistical analysis was performed. See also Figure S4
Figure 6
Figure 6. Reversion of EMT promotes colonization in distant sites
(A) Representative images of tumor sections co-stained with Twist1 (green), Ki67 (red), and nuclear stain (blue). Tumor sections from control and doxycycline-treated K5-Twist1 mice were co-stained for Twist1 and Ki67 to identify proliferation tumor cells. Bar=50μm. (B and C) Relative levels of Twist1 and Ki67 expression in primary tumors from control and doxycycline-treated K5-Twist1 mice. Values were plotted on a histogram ± SEM. Student’s t test statistical analysis was performed. n=tumor samples per group. (D–F) Representative images of lung sections co-stained for K5 (green), Twist1 (brown) or Ki67 (brown) and quantification of Twist1 and Ki67 expression at 7 days post tail vein injection. Values were plotted on a histogram ± SEM. Student’s t test statistical analysis was performed. n=mice per group.
Figure 7
Figure 7. Reversible EMT model for tumor metastasis
During tumor progression, local microenvironmental cues in the primary tumor activate the EMT program. This triggers local tumor cell invasion and intravasation into the blood vessels. Circulating tumor cells maintain an EMT phenotype and travel to a distant site, after which the cells extravasate into the tissue parenchyma. The loss of EMT activating signals is essential for tumor cells to reverse phenotype and proliferate to form macrometastases.

Comment in

References

    1. Abel EL, Angel JM, Kiguchi K, DiGiovanni J. Multi-stage chemical carcinogenesis in mouse skin: fundamentals and applications. Nat Protoc. 2009;4:1350–1362. - PMC - PubMed
    1. Batlle E, Sancho E, Franci C, Dominguez D, Monfar M, Baulida J, Garcia De Herreros A. The transcription factor snail is a repressor of E-cadherin gene expression in epithelial tumour cells. Nat Cell Biol. 2000;2:84–89. - PubMed
    1. Beard C, Hochedlinger K, Plath K, Wutz A, Jaenisch R. Efficient method to generate single-copy transgenic mice by site-specific integration in embryonic stem cells. Genesis. 2006;44:23–28. - PubMed
    1. Bierie B, Moses HL. Tumour microenvironment: TGFbeta: the molecular Jekyll and Hyde of cancer. Nat Rev Cancer. 2006;6:506–520. - PubMed
    1. Blick T, Widodo E, Hugo H, Waltham M, Lenburg ME, Neve RM, Thompson EW. Epithelial mesenchymal transition traits in human breast cancer cell lines. Clin Exp Metastasis. 2008;25:629–642. - PubMed

Publication types

MeSH terms