. 2013 Mar 1:232:32-44.
doi: 10.1016/j.neuroscience.2012.11.023. Epub 2012 Nov 29.

VMAT1 deletion causes neuronal loss in the hippocampus and neurocognitive deficits in spatial discrimination

Affiliations

VMAT1 deletion causes neuronal loss in the hippocampus and neurocognitive deficits in spatial discrimination

P K Multani et al. Neuroscience. .

Abstract

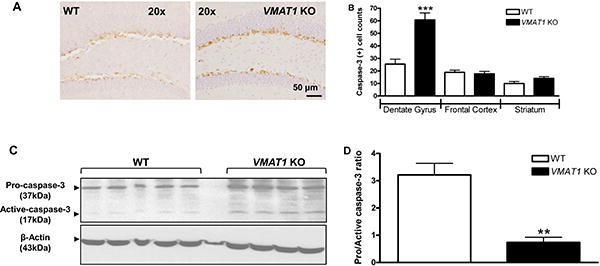
Vesicular monoamine transporters (VMAT) are involved in presynaptic storage and release of neurotransmitters. While it was thought initially that only VMAT2 is brain expressed and VMAT1 is present only in the periphery, recent data have challenged the exclusive expression of VMAT2 in the brain. To further elucidate the role of VMAT1 brain expression and its potential role in neuropsychiatric disorders, we have investigated mice lacking VMAT1. Comparison of wildtype and knock-out (KO) mice using qPCR and immunohistochemistry documents the expression of VMAT1 in the brain. Deletion of VMAT1 leads to increased hippocampal apoptosis and reduced neurogenesis as assessed by caspase-3-labeling and 5-bromo-deoxy-uridine-labeling. Behavioral data show that mice lacking VMAT1 have neurocognitive deficits. VMAT2 expression is not altered in VMAT1 KO mice, suggesting a distinct role of VMAT1. Our data support VMAT1 brain expression and suggest that VMAT1 plays a key role in survival of hippocampal neurons and thus might contribute to neurocognitive deficits observed in neuropsychiatric disorders.


Figures

Figure 1
Figure 1. Characterization of VMAT1 KO mice
(A) Schematic representation of VMAT1 gene disruption by insertion of an IRES/LacZ/Neo cassette at exon 4 and relative primer (red arrows) positions for genotyping. (B) Genotypes of wild type (WT), heterozygous (VMAT1 HET) and homozygous knockout (VMAT1 KO) mice are shown. A 227 base pairs band is expected for WT animals, a 479 base pairs band is expected for VMAT1 KO animals, and both bands are expected for heterozygotes (VMAT1 HET). (C) Gene expression analysis for the detection of VMAT1 mRNA expression in various brain regions and adrenal gland of WT (WT, white bars), heterozygous (VMAT1 HET, grey bars) and homozygous KO (VMAT1KO, black bars) mice. VMAT1KO shows complete absence of VMAT1 mRNA expression in the frontal cortex, striatum, hippocampus and adrenal gland with respect to WTs and VMAT1 HETs. Shown are representative results of two separate quantitative relative mRNA expression experiments, each done in triplicates. Data are expressed as mean ± S.D.
Figure 2
Figure 2. VMAT1 is expressed in various brain regions and adrenal gland
(A) Immunostaining for VMAT1 expression was carried out using antibody SC15313 as detailed in the materials and methods. Digital photomicrographs of VMAT1-immunoreactivity (ir) are shown. Frontal cortex (panels C and D), striatum (panels E and F), dentate gyrus (panels G and H) and adrenal medulla (panels I and J) from WT (WT, panels C, E, G and I) and VMAT1KO (VMAT1KO, panels D, F, H and J) mice were stained for VMAT1-ir. Ni-DAB staining for VMAT1 localized in neuronal cell bodies (indicated by black arrows) is observed in WT, but not VMAT1KO animals. In addition to the SC15313 anti -VMAT1 antibody, VMAT1-ir was confirmed with the use of ab87595 anti-VMAT1 antibody in WT adrenal glands (panel L) and VMAT1 absence in adrenal gland of VMAT1KO animals (panel M). Scale bar and magnification for frontal cortex, striatum and adrenal medulla is 100 μm at 40x, and for dentate gyrus is 200 μm at 20x. (B) Double-immunolabeled fluorescent microscopic 20x magnification images of VMAT1 (green) and synaptophysin (red) in the prefrontal cortex (panel A,B,C), striatum (panel D,E,F) and dentate gyrus (panel G,H,I). Paraffin embedded 6μm brain slices for each of these regions were obtained from WT animals (n=4). VMAT1 (green staining, black arrows) was colabeled with synaptophysin (red staining, black arrows). Representative image of VMAT1 immunoreactive cell body shown in the green with diffuse cytoplasmic staining and a small population of more intense vesicular compartment-like structures shown by synaptophysin labeling (panel B, E and H). Double labeling revealed punctate staining of synaptophysin and VMAT1 with apparent co-localization (Yellow Merge, C, F, I black arrows). Scale bars: A, B, 200 μm.
Figure 3
Figure 3. Deletion of VMAT1 increases neuronal apoptosis
(A) Immunohistochemical detection of caspase-3-positive cells in the hippocampus of WT and VMAT1KO mice. Representative images show caspase-3 labeling in the granular cells of the dentate gyrus. 20× magnifications, scale bar is 50 μm. Note the neuronal morphology and caspase-3 labeling in these cells. (B) Quantification of the number of caspase-3 positive cells per 40 μm coronal section in brain regions analyzed (dentate gyrus, cortex and striatum n = 8 per group, 4 brain sections per animal). Image-Pro Plus software was used for counting of caspase-3 cells as described in materials and methods. A significant increase in the number of caspase-3 labeled cells was observed in the dentate gyrus of KO (VMAT1KO, black bars) as compared to WT (WT, white bars) mice. (C) Western immunoblot detection of pro- (37 kDa) and cleaved, active- caspase-3 (17 kDa) in the cytosolic fractions of hippocampus from WT (WT, left panel) and KO (VMAT1KO, right panel) mice brain. The arrowheads indicate both the pro- (37 kDa) and the active- (17 kDa cleaved) caspase-3 fragment, indicative of caspase- 3 activation (upper panels), β-actin (lower panel) served as loading control. (D) Histogram showing quantification of procaspase-3/active caspase-3 ratio in WT (WT, white bars, n=5) and KO (VMAT1KO, black bars, n=4) hippocampus. Image J was used to quantify westerns. All histograms were plotted between WT and VMAT1KO group Data was analyzed using GraphPad Prism statistical software. Two-tailed non-parametric Student's t-test was employed for the statistical analysis of between-group differences (WT versus VMAT1KO). Data are expressed as mean ± S.E.M.; ***p<0.001**p< 0.01.
Figure 4
Figure 4. Electron microscopy confirms apoptosis in VMAT1KO mice
Electron microscope images show the ultra-structural features of normal nuclei and morphological features of apoptosis in WT (WT, panel A) and KO (VMAT1KO, panels B, C and D) dentate gyrus, respectively. Apoptotic cells display (panels B, C and D) plasma membrane blebbing, and partially condensed chromatin in an oval, pyknotic nucleus as morphological features of apoptosis. Original magnifications: (A), (B) and (D) 7500x; Bar=2 μm and (C) 15000x; Bar=500 nm. N=normal nucleus, AN=apoptotic nucleus
Figure 5
Figure 5. Absence of VMAT1 reduces hippocampal cell proliferation
To assess cell proliferation in the hippocampus, wild type (WT, white bars, n=8) and knockout (VMAT1 KO, black bars, n=9) mice were sacrificed 24 h after the last BrdU injection. Values are expressed as the number of BrdU positive cells per 10,000 7-AAD events. VMAT1KO mice demonstrated a significant reduction of BrdU incorporation in the hippocampus compared to WT mice (t (16) = 2.78, p=0.01). Data was analyzed using GraphPad Prism statistical software. Two-tailed non-parametric Student's t-test was employed for the statistical analysis of between-group differences (wild type versus VMAT1 KO). Data are shown as mean ± S.E.M.; *p=0.01.
Figure 6
Figure 6. VMAT1KO mice show deficits in spatial object recognition, but not in contextual fear conditioning memory
(A) Percentage of the preference for the displaced object by WT (WT, white bars, n=12) and KO (VMAT1KO, black bars, n=12) mice. (B) Total exploration of objects by WT (WT, white bars, n=12) and KO (VMAT1KO, black bars, n=12) mice. (C) Freezing percentage of WT (WT, white bars, n=8) and KO (VMAT1KO, black bars, n=8) mice on contextual fear conditioning test. Pre- and post-shock data represent baseline and immediate, unconditioned responses before and after foot shock, respectively. Freezing behavior in the conditioned context test session 24h after training is also shown. Data was analyzed using GraphPad Prism statistical software. Two-tailed non-parametric Student's t-test was employed for the statistical analysis of between-group differences (WT versus VMAT1KO). Data are expressed as mean ± S.E.M.; **p<0.01.
Figure 7
Figure 7. Deletion of VMAT1 does not affect VMAT2 expression
(A) Gene expression analysis for the detection of VMAT2 in various brain regions and adrenal gland of wild type (WT, white bars) and homozygous VMAT1 KO (VMAT1 KO, black bars) mice. No difference in VMAT2 mRNA expression was observed between the WT and VMAT1 KO mouse brain regions or adrenal glands. Shown are the representative results of two separate quantitative relative mRNA expression experiments, each done in triplicates. (B) Ni-DAB immunostaining for VMAT2 expression in coronal sections of the striatum was done using VMAT2 specific antibody as described in the materials and methods. Digital photomicrographs of VMAT2-immunoreactivity from wild type (WT) and VMAT1 knockout (VMAT1 KO) mice striatum are shown. Scale bar and magnification for striatum is 200 μm at 20×. (C) Quantification of VMAT2-immunolabelled cell counts in the striatum (four brain sections per animal). No statistical difference between the wild type (WT, white bars, n=5) and VMAT1 knockout (VMAT1 KO, black bars, n=5) was observed for the VMAT2-positive cell counts in the striatum. Image-Pro Plus software was used for the counting of VMAT2 labeled cells as described in materials and methods. Two-tailed non-parametric Student's t-test was employed for the statistical analysis between-group differences (wild type versus VMAT1 KO). Data are expressed as means ± S.E.M. (D) Gene expression analysis for the detection of VMAT1 and VMAT2 mRNA expression in various brain regions and adrenal gland of WT mice. VMAT2 is highest expressed in striatum whereas VMAT1 shows strong expression in adrenal gland. Shown are results of qPCR mRNA expression analyses, each done in triplicates. Average Ct and delta Ct values are shown.
Figure 8
Figure 8. Ex vivo autoradiography with [18F]AV-133 shows no difference in the VMAT2 labeling
(A) Quantitative distribution of PET ligand in various brain regions. The distribution of [18F]-AV-133 was measured in wild type (WT), VMAT1 KO and VMAT2 heterozygote (24-33g, 8-12 weeks old, n=4 per group). The percentage dose per gram of tissue was calculated by a comparison of the tissue counts to diluted aliquots of the injected material. T-tests were done only for regional brain distribution data. *p<0.05 (B) Localization of PET ligand in various brain regions of (1) wild type (WT) (2) VMAT1 KO (3) VMAT2 Het (n=4 per group). Sections were exposed to Biomax MR films overnight and processed with Kodak fixer and developer. Images were digitized with an Epson Perfection 4490 Photo scanner.

Similar articles

Cited by

References

    1. Ashe KM, Chiu WL, Khalifa AM, Nicolas AN, Brown BL, De Martino RR, Alexander CP, Waggener CT, Fischer-Stenger K, Stewart JK. Vesicular monoamine transporter-1 (VMAT-1) mRNA and immunoreactive proteins in mouse brain. Neuro Endocrinol Lett. 2011;32:253–258. - PubMed
    1. Balu DT, Hodes GE, Hill TE, Ho N, Rahman Z, Bender CN, Ring RH, Dwyer JM, Rosenzweig-Lipson S, Hughes ZA, Schechter LE, Lucki I. Flow cytometric analysis of BrdU incorporation as a high-throughput method for measuring adult neurogenesis in the mouse. J Pharmacol Toxicol Methods. 2009;59:100–107. - PMC - PubMed
    1. Benes FM, Kwok EW, Vincent SL, Todtenkopf MS. A reduction of nonpyramidal cells in sector CA2 of schizophrenics and manic depressives. Biological psychiatry. 1998;44:88–97. - PubMed
    1. Bly M. Mutation in the vesicular monoamine gene, SLC18A1, associated with schizophrenia. Schizophrenia research. 2005;78:337–338. - PubMed
    1. Breunig JJ, Silbereis J, Vaccarino FM, Sestan N, Rakic P. Notch regulates cell fate and dendrite morphology of newborn neurons in the postnatal dentate gyrus. Proceedings of the National Academy of Sciences of the United States of America. 2007;104:20558–20563. - PMC - PubMed

Publication types

MeSH terms