. 2013 Feb;241(2):149-66.
doi: 10.1016/j.mbs.2012.11.004. Epub 2012 Nov 28.

pH-induced gene regulation of solvent production by Clostridium acetobutylicum in continuous culture: parameter estimation and sporulation modelling

Affiliations

pH-induced gene regulation of solvent production by Clostridium acetobutylicum in continuous culture: parameter estimation and sporulation modelling

Graeme J Thorn et al. Math Biosci. 2013 Feb.

Abstract

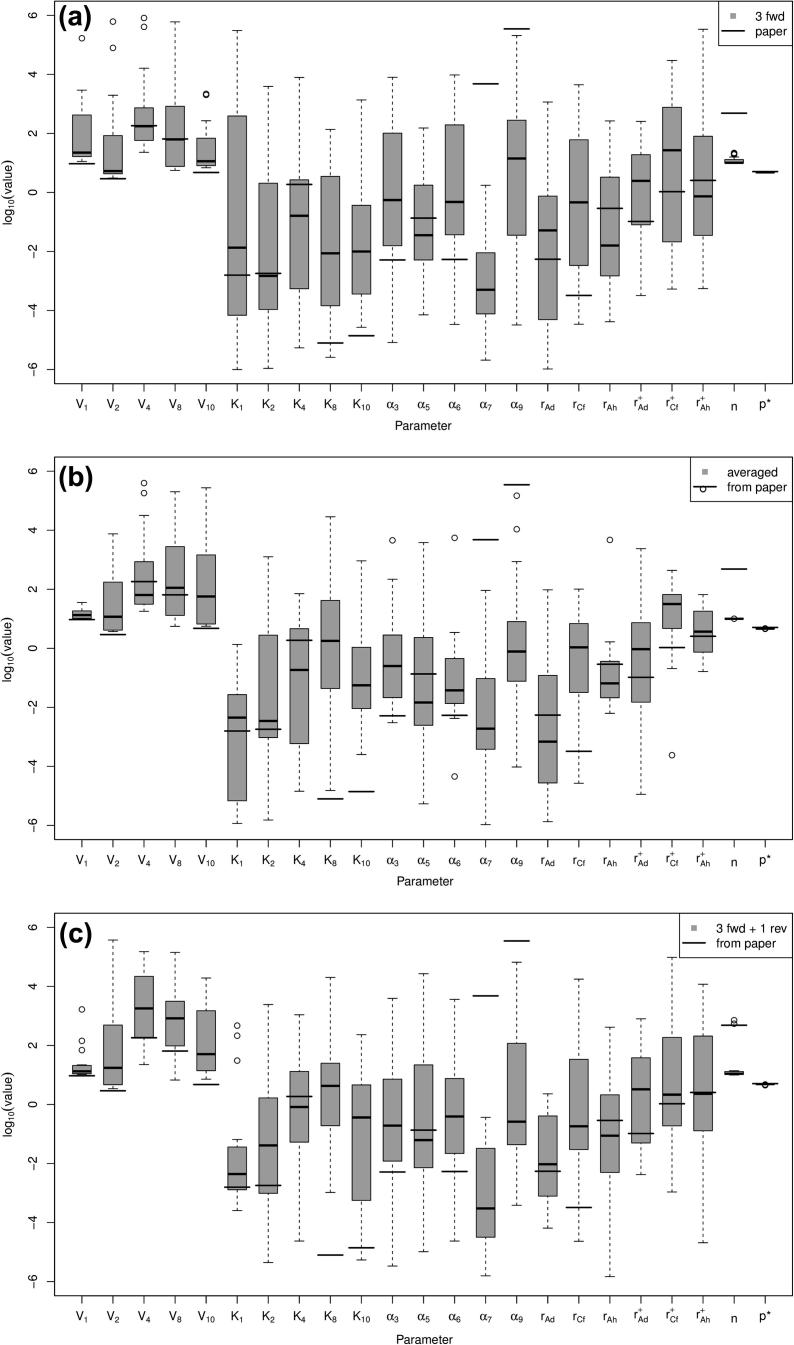
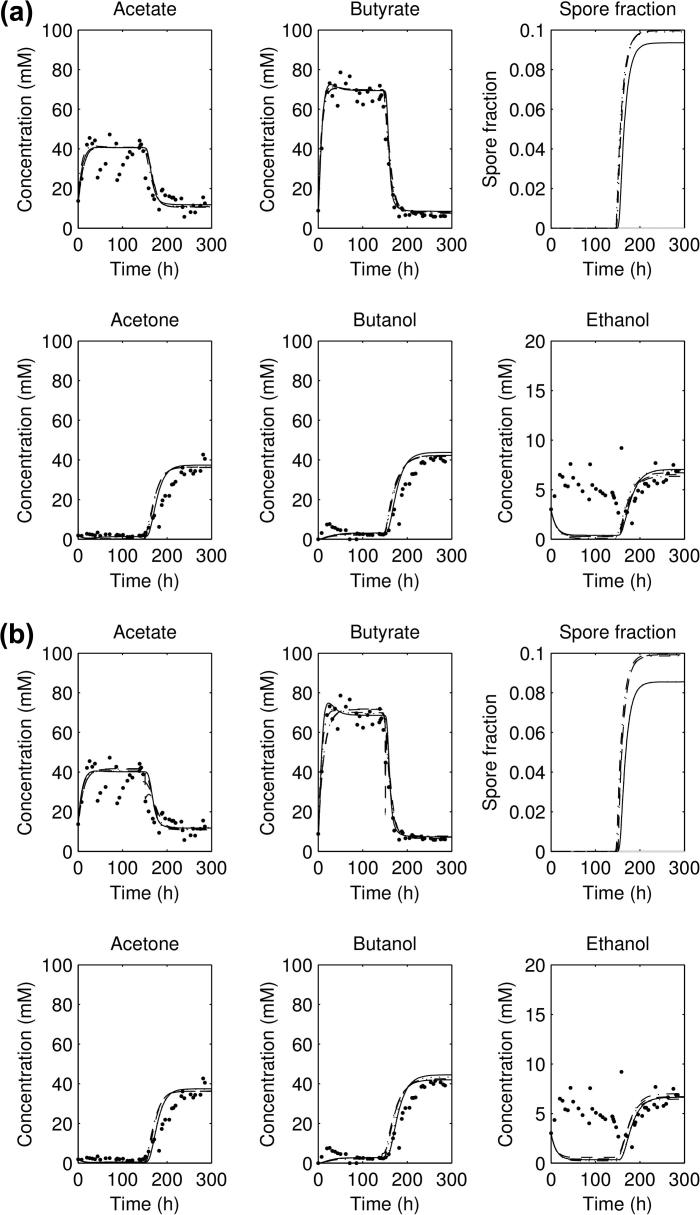
The acetone-butanol (AB) fermentation process in the anaerobic endospore-forming Gram-positive bacterium Clostridium acetobutylicum is useful as a producer of biofuels, particularly butanol. Recent work has concentrated on trying to improve the efficiency of the fermentation method, either through changes in the environmental conditions or by modifying the genome to selectively favour the production of one particular solvent over others. Fermentation of glucose by C. acetobutylicum occurs in two stages: initially the acids acetate and butyrate are produced and excreted and then, as the external pH falls, acetate and butyrate are ingested and further metabolised into the solvents acetone, butanol and ethanol. In order to optimise butanol production, it is important to understand how pH affects the enzyme-controlled reactions in the metabolism process. We adapt an ordinary differential equation model of the metabolic network with regulation at the genetic level for the required enzymes; parametrising the model using experimental data generated from continuous culture, we improve on previous point predictions (S. Haus, S. Jabbari, T. Millat, H. Janssen, R.-J. Fisher, H. Bahl, J. R. King, O. Wolkenhauer, A systems biology approach to investigate the effect of pH-induced gene regulation on solvent production by Clostridium acetobutylicum in continuous culture, BMC Systems Biology 5 (2011)) [1] both by using a different optimisation approach and by computing confidence intervals and correlation coefficients. We find in particular that the parameters are ill-determined from the data and that two separate clusters of parameters appear correlated, reflecting the importance of two metabolic intermediates. We extend the model further to include another aspect of the clostridial survival mechanism, sporulation, and by computation of the Akaike Information Criterion values find that the there is some evidence for the presence of sporulation during the shift.


Figures

Fig. 1
Fig. 1
Diagram of the simplified Clostridium acetobutylicum metabolism network (after Haus et al. [1]), showing the ten reaction considered here, and the relevant genes encoding for the metabolic enzymes (G – glucose, AC – acetyl-CoA, A – acetate, AaC – acetoacetyl-CoA, BC – butyryl-CoA, B – butyrate, En – ethanol, Bn – butanol, Aa – acetoacetate, An – acetone, ctfA/B – CoA-transferase (with two subunits), adc – acetoacetate decarboxylase, adhE – aldehyde dehydrogenase). Note that the (2) denotes how many of the individual molecules are involved in each reaction, and that the gene marked adhE in this network is often called adhE1.
Fig. 2
Fig. 2
Plots of the acid and solvent concentrations from experimental data and simulated, using the (solid line) parameters from fitting to the three forward experiments; (dotted) parameters from fitting to the averaged data and (dashed) parameters from fitting to all four experiments: (a) first forward experiment and (b) second forward experiment.
Fig. 3
Fig. 3
Plots of the acid and solvent concentrations from experimental data and simulated, using the (solid line) parameters from fitting to the three forward experiments; (dotted) parameters from fitting to the averaged data and (dashed) parameters from fitting to all four experiments: (a) third forward experiment and (b) reverse experiment.
Fig. 4
Fig. 4
Boxplot of log10(parameters) for fitted parameter for the three ways of organising data: (a) all three forward experiments; (b) averaged data set and (c) all four experiments. Parameters fitted elsewhere are shown by the thick lines.
Fig. 5
Fig. 5
Plot of dependent (solid lines) and independent (dashed lines) confidence intervals for the ten best-scoring parameter sets from: (left) all three forward experiments, (centre) averaged data set, (right) all four experiments (3 forward, 1 reverse): (a) parameter V1; (b) parameter K2 and (c) parameter α6.
Fig. 6
Fig. 6
Plot of dependent (solid lines) and independent (dashed lines) confidence intervals for the ten best-scoring parameter sets from: (left) all three forward experiments, (centre) averaged data set, (right) all four experiments (3 forward, 1 reverse): (a) parameter rAd+; (b) parameter n and (c) parameter p.
Fig. 7
Fig. 7
Averaged correlation matrix between the parameters of the lowest 25 scoring parameter sets, averaged over all three ways of organising the data.
Fig. 8
Fig. 8
Diagrams of the production models explored in this paper: model 1b, where sporulation and solventogenesis are independently triggered following the pH switch; model 1c, where sporulation and solventogenesis are triggered simultaneously following the pH switch; model 1d, where solventogenesis is triggered following the pH switch, and sporulation occurs after a delay.
Fig. 9
Fig. 9
Boxplot of log10(parameters) for parameters fitted to three forward experiments for sporulation models: (a) Model 1a and (b) Model 1b. Parameters for the non-sporulation model, fitted elsewhere are shown by thick lines.
Fig. 10
Fig. 10
Boxplot of log10(parameters) for parameters fitted to three forward experiments for sporulation models: (a) Model 1c and (b) Model 1d. Parameters for the non-sporulation model, fitted elsewhere are shown by thick lines.
Fig. 11
Fig. 11
Plot of the acid and solvent concentrations and sporulation fraction for the second forward experiment, using the five lowest-scoring parameter sets for: (a) sporulation model 1a and (b) sporulation model 1b; as continuous lines, with experimental data as points.
Fig. 12
Fig. 12
Plot of the acid and solvent concentrations and sporulation fraction for the second forward experiment, using the five lowest-scoring parameter sets for: (a) sporulation model 1c and (b) sporulation model 1d; as continuous lines, with experimental data as points.
Fig. 13
Fig. 13
Plot of the acid and solvent concentrations and sporulation fraction for the second forward experiment, using the five lowest-scoring parameter sets with unrestricted spore production rate k for sporulation model 1d. Note that the fit for the solvents acetone, butanol and ethanol post-shift are better than in Fig. 12b.
Fig. 14
Fig. 14
Plot of: (a) log10(residual sum of squares) for the 10 best-fitting parameter sets for the four models: Model 0 (non-sporulation) and the four sporulation models (1a–1b) and (b). Akaike information criterion (AIC) values for the 25 best-fitting parameter sets for the four models: Model 0 (non-sporulation) and the four sporulation models (1a–1b).

Similar articles

Cited by

References

    1. Haus S., Jabbari S., Millat T., Janssen H., Fisher R.-J., Bahl H., King J.R., Wolkenhauer O. A systems biology approach to investigate the effect of pH-induced gene regulation on solvent production by Clostridium acetobutylicum in continuous culture. BMC Systems Biology. 2011;5 - PMC - PubMed
    1. Jones D.T., Woods D.R. Acetone–butanol fermentation revisited. Microbiology Reviews. 1986;50 - PMC - PubMed
    1. Gottwald M., Gottschalk G. The internal pH of Clostridium acetobutylicum and its effect on the shift from acid to solvent formation. Archives of Microbiology. 1985;143
    1. Dürre P., Fischer R.-J., Kuhn A., Lorenz K., Schreiber W., Stürzenhofecker B., Ullmann S., Winzer K., Sauer U. Solventogenic enzymes of Clostridium acetobutylicum: catalytic properties genetic organization and transcriptional regulation. FEMS Microbiology Reviews. 1995;17 - PubMed
    1. Bahl H., Andersch W., Braun K., Gottschalk G. Effect of pH and butyrate concentration on the production of acetone and butanol by Clostridium acetobutylicum grown in continuous culture. European Journal of Applied Microbiology and Biotechnology. 1982;14

Publication types

LinkOut - more resources