. 2013 Mar 1;22(5):904-18.
doi: 10.1093/hmg/dds496. Epub 2012 Nov 30.

MicroRNA-21 silencing enhances the cytotoxic effect of the antiangiogenic drug sunitinib in glioblastoma

Affiliations

MicroRNA-21 silencing enhances the cytotoxic effect of the antiangiogenic drug sunitinib in glioblastoma

Pedro M Costa et al. Hum Mol Genet. .

Abstract

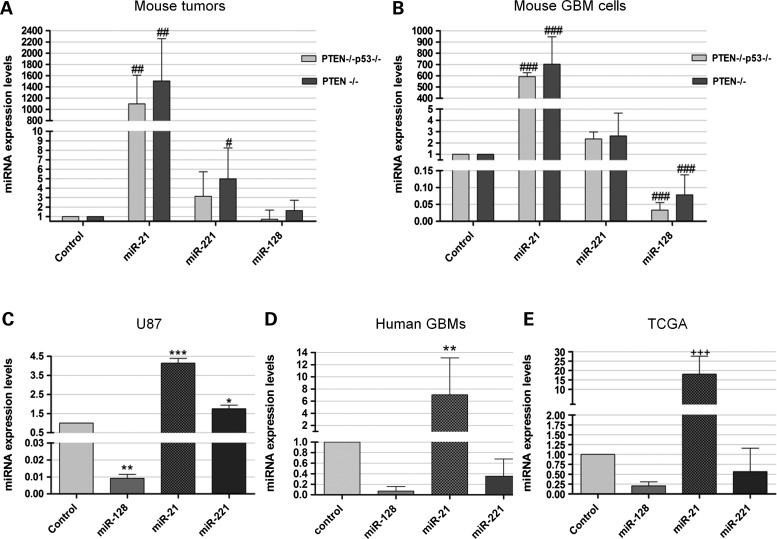
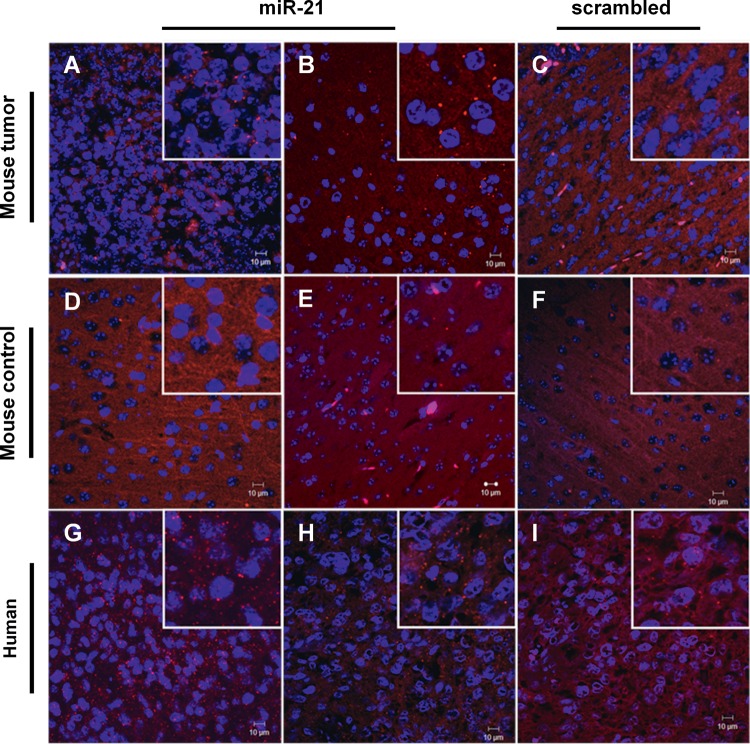
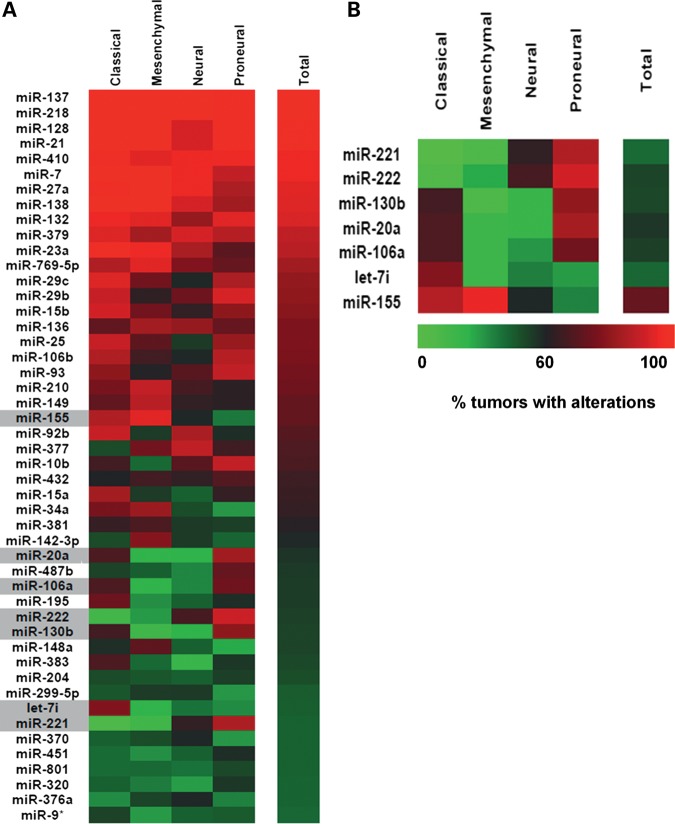
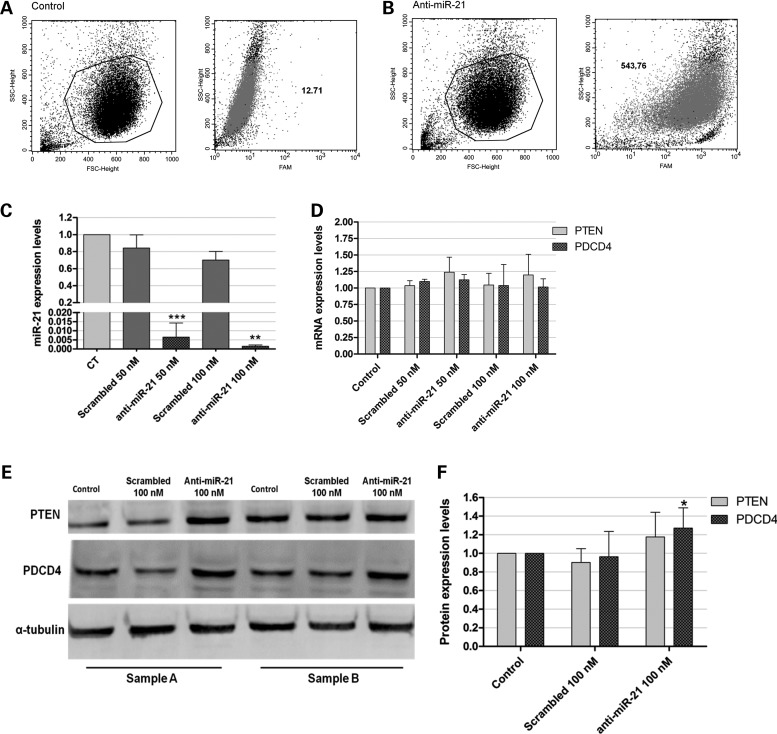
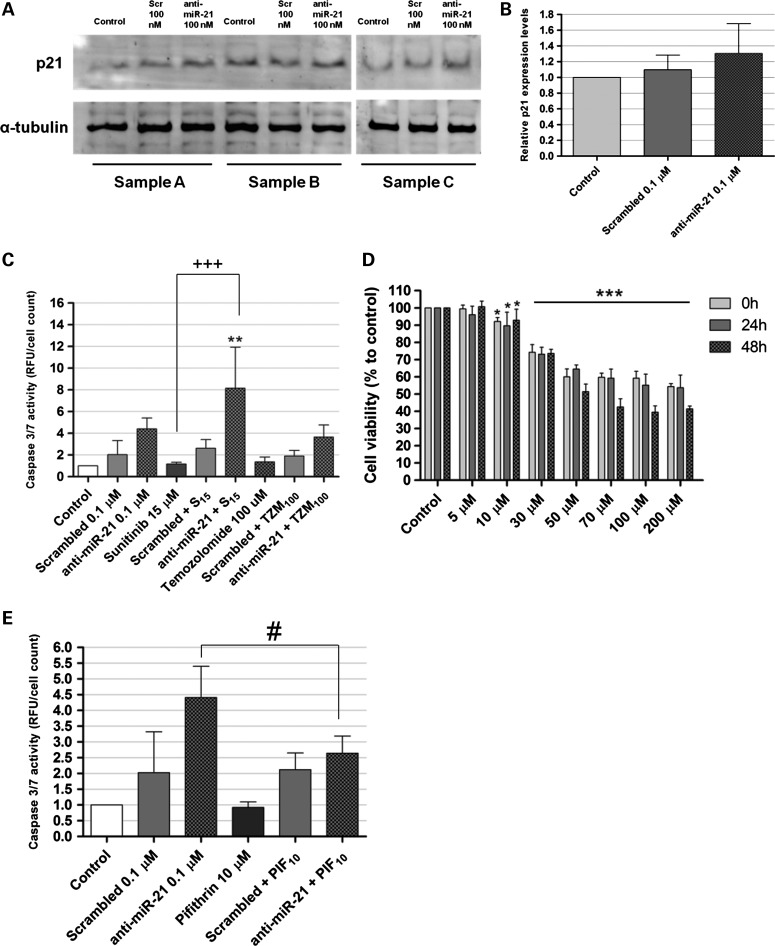
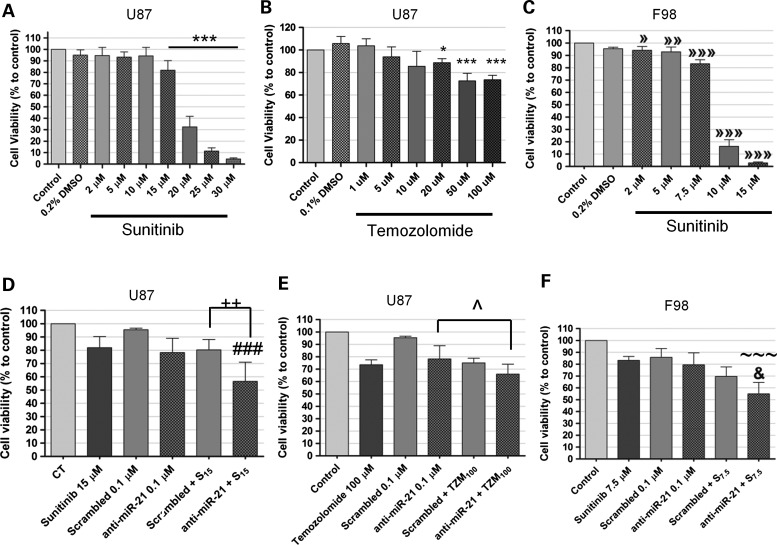
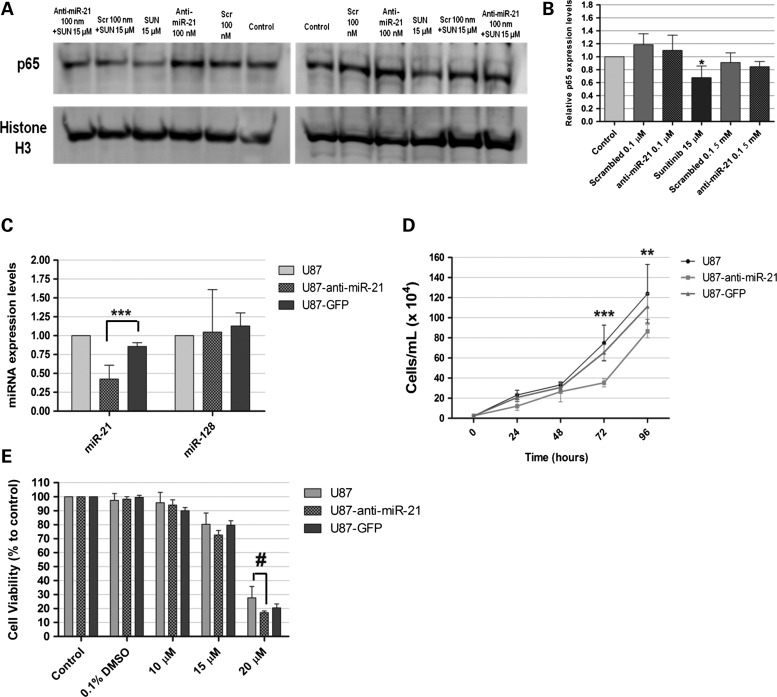
Highly malignant glioblastoma (GBM) is characterized by high genetic heterogeneity and infiltrative brain invasion patterns, and aberrant miRNA expression has been associated with hallmark malignant properties of GBM. The lack of effective GBM treatment options prompted us to investigate whether miRNAs would constitute promising therapeutic targets toward the generation of a gene therapy approach with clinical significance for this disease. Here, we show that microRNA-21 (miR-21) is upregulated and microRNA-128 (miR-128) is downregulated in mouse and human GBM samples, a finding that is corroborated by analysis of a large set of human GBM data from The Cancer Genome Atlas. Moreover, we demonstrate that oligonucleotide-mediated miR-21 silencing in U87 human GBM cells resulted in increased levels of the tumor suppressors PTEN and PDCD4, caspase 3/7 activation and decreased tumor cell proliferation. Cell exposure to pifithrin, an inhibitor of p53 transcriptional activity, reduced the caspase activity associated with decreased miR-21 expression. Finally, we demonstrate for the first time that miR-21 silencing enhances the antitumoral effect of the tyrosine kinase inhibitor sunitinib, whereas no therapeutic benefit is observed when coupling miR-21 silencing with the first-line drug temozolomide. Overall, our results provide evidence that miR-21 is uniformly overexpressed in GBM and constitutes a highly promising target for multimodal therapeutic approaches toward GBM.


Figures

Figure 1.
Figure 1.
MiRNA expression levels in mouse and human GBM tissue samples and cell lines. MiR-21, miR-128 and miR-221 expression levels in (A) double-floxed (PTEN−/−p53−/−) and PTEN-floxed (PTEN−/−) mouse tumor samples (n = 6) and (B) double-floxed (PTEN−/−p53−/−) and PTEN-floxed (PTEN−/−) mouse GBM cells, when compared with control sample (n = 7), obtained from double-floxed mouse brains following animal injection with a control vector (no PDGF). MiR-21, miR-128 and miR-221 expression levels in human (C) U87 cells and (D) tumor samples from the Tissue Bank (n = 22), when compared with control epileptic brain tissue (n = 4). (E) MiR-21, miR-128 and miR-221 expression levels obtained from the analysis of the TCGA data on 188 human GBMs. *P < 0.05, **P < 0.01, ***P < 0.001 when compared with control epileptic tissue. #P < 0.05, ##P < 0.01, ###P < 0.001 when compared with control mouse brain. +++P < 0.001 when compared with normal human brain.
Figure 2.
Figure 2.
FISH staining in mouse and human GBM tissue samples. FISH staining in (A–C) double-floxed mouse GBM sections and (D–F) control mouse brain tissue (n = 2) stained with (A, B, D and E) miR-21-specific or (C and F) scrambled LNA probe. Nuclear staining was obtained using DNA-binding Hoechst 33342. MiR-21 staining (red dots) is observed in the GBM sections, surrounding the cell nucleus (blue), whereas residual staining is observed in control brain sections. Human GBM sections (n = 2) were stained with (G and H) miR-21-specific or (I) non-coding (scrambled) LNA probe. MiR-21 staining (red dots) is predominantly cytoplasmic, surrounding the cell nucleus (blue). Control experiments targeting the endogenous U6snRNA (positive control) and without LNA probe (negative control) were performed in parallel (not shown). Images were obtained by confocal microscopy with a 40× EC Plan-Neofluar. Scale corresponds to 10 µm.
Figure 3.
Figure 3.
Analysis of TCGA data on 188 human GBMs. (A) Heat map representation of the miRNAs dysregulated in at least 45% (85/188) of the tumors (n = 188), displayed as percentage of tumors with alterations in each of the four GBM subtypes (classical, mesenchymal, neural and proneural). Highlighted in gray are the miRNAs represented in (B). (B) MiRNAs whose dysegulation is associated with specific GBM subtypes, by applying a significance threshold of 0.05 and a FDR of 5% (0.05). Statistical analysis was performed as described in the Materials and Methods section.
Figure 4.
Figure 4.
Lipoplex-mediated delivery of anti-miR-21 oligonucleotides in U87 human GBM cells and miR-21, PTEN and PDCD4 expression after oligonucleotide-mediated miR-21 silencing. For the assessment of lipoplex-cell association, U87 cells were incubated with lipoplexes for 4 h, rinsed with PBS and prepared for flow cytometry analysis (as described in Supplementary Materials and Methods). Viable cells were gated based on morphologic features, including cell volume (given by the forward scatter, FSC) and cell complexity (given by the side scatter, SSC) (left plots in [A and B]). Fluorescent intensity plots of U87 cells (A) untreated or (B) transfected with lipoplexes at a final concentration of 100 nm anti-miR-21 oligonucleotides are shown in the right plots in (A) and (B). Mean fluorescence values (geometric mean) are indicated for each plot. (C) miR-21 and (D) PTEN and PDCD4 mRNA expression levels in U87 cells 48 h after transfection with anti-miR-21 or scrambled oligonucleotides (n = 3), at a final oligonucleotide concentration of 50 or 100 nm. MiR-21 expression levels, normalized to the reference U6snRNA, as well as PTEN and PDCD4 expression levels, normalized to the reference HPRT1, are presented as relative expression values to control untreated cells. (E) Representative gel showing PTEN and PDCD4 protein levels in U87 cells 48 h after transfection with anti-miR-21 or scrambled oligonucleotides (n = 3) at a final oligonucleotide concentration of 100 nm. (F) Quantification of PTEN and PDCD4 bands observed in (E), corrected for individual α-tubulin signal intensity. Results are presented as PTEN and PDCD4 expression levels relative to control. *P < 0.05, **P < 0.01, ***P < 0.001 when compared with cells transfected with a similar amount of scrambled oligonucleotides.
Figure 5.
Figure 5.
Western blot detection of p21 and caspase activation in U87 human GBM cells. (C) Caspase 3/7 activity in U87 cells transfected with anti-miR-21 or scrambled oligonucleotides (0.1 μm), either per se or in combination. (A) Representative gel showing p21 levels in U87 cells 48 h after transfection with anti-miR-21 or scrambled (Scr) oligonucleotides (n = 3) at a final oligonucleotide concentration of 100 nm. (B) Quantification of p21 bands observed in (A), corrected for individual α-tubulin signal intensity bination with exposure to 15 μm sunitinib or 100 μm temozolomide (n = 3). Twenty-four hours after transfection, cells were exposed to 15 μm sunitinib or 100 μm temozolomide for 24 h, rinsed with PBS, after which cells were either prepared for caspase detection (cells incubated with sunitinib) or further cultured for 24 h and then prepared for caspase detection (cells incubated with temozolomide). Results, presented as relative fluorescence units with respect to control untreated cells, were normalized for the number of cells in each condition. Scrambled/anti-miR-21 + S15/TZM100 cells were transfected with scrambled or anti-miR-21 oligonucleotides and further incubated with 15 μm sunitinib or 100 μm temozolomide. **P < 0.01 when compared with cells transfected with scrambled oligonucleotides and further incubated with 15 μm sunitinib. +++ P < 0.001 when compared with cells exposed to 15 μm sunitinib. #P < 0.01 when compared with cells transfected with scrambled oligonucleotides (one-way analysis of variance with Benferroni's posthoc test). (D) Cell viability was evaluated by the Alamar Blue assay, immediately (0), 24 h (24 h) or 48 h (48 h) after incubation with pifithrin-α. *P < 0.05, ***P < 0.001 when compared with untreated cells. (E) Caspase 3/7 activity in U87 cells transfected with anti-miR-21 or scrambled oligonucleotides (0.1 μm), either per se or in combination with exposure to 10 μm pifithrin-α (n = 3). Four hours after transfection, cells were incubated with 10 μm pifithrin-α for 24 h, and further incubated for 24 h in fresh DMEM medium. Caspase activity was assessed as described in the Materials and Methods section. Results, presented as relative fluorescence units with respect to control untreated cells, were normalized for the number of cells in each condition. Scrambled/anti-miR-21 + PIF100 cells were transfected with scrambled or anti-miR-21 oligonucleotides and further incubated with 10 μm pifithrin-α. #P < 0.01 when compared with cells transfected with anti-miR-21 oligonucleotides.
Figure 6.
Figure 6.
Cell viability after incubation with sunitinib or temozolomide, either per se or in combination with the transfection of anti-miR-21 or scrambled oligonucleotides. Twenty-four hours before any experiment, U87 and F98 cells were plated onto 24-well plates at a density of 3.5 × 10⁴ and 3 × 10⁴ cells/well (respectively). Cells were transfected for 4 h with anti-miR-21 or scrambled oligonucleotides, rinsed with PBS, cultured for 24 h in fresh DMEM and then exposed to sunitinib or temozolomide for 24 h. Cell viability was evaluated by the Alamar Blue assay (as described in the Materials and Methods section) immediately (sunitinib) or 24 h (temozolomide) after incubation with the drug. Cell viability in (A and B) U87 and (C) F98 glioma cells after incubation with different concentrations of (A and C) sunitinib or (B) temozolomide for 24 h. Cell viability in (D and E) U87 and (F) F98 cells after incubation with sunitinib (D and F) or temozolomide (E), either per se or in combination with the transfection of anti-miR-21 or scrambled oligonucleotides. Scrambled/anti-miR-21 + S7.5/S15/TZM100 cells were transfected with scrambled or anti-miR-21 oligonucleotides and further incubated with 7.5 or 15 μm sunitinib or 100 μm temozolomide. *P < 0.05, ***P < 0.001 when compared with control untreated U87 cells. »P < 0.05, »»P < 0.01, »»»P < 0.001 when compared with control untreated F98 cells. ++P < 0.01 when compared with U87 cells transfected with scrambled oligonucleotides and further incubated with 15 μm sunitinib. ###P < 0.001 when compared with U87 cells exposed to 15 μm sunitinib. ^P < 0.05 when compared with U87 cells transfected with anti-miR-21 oligonucleotides. &P < 0.05 when compared with F98 cells transfected with scrambled oligonucleotides and further incubated with 7.5 μm sunitinib. ∼∼∼P < 0.001 when compared with F98 cells transfected with anti-miR-21 oligonucleotides or incubated with 7.5 μm sunitinib.
Figure 7.
Figure 7.
Western blot detection of NF-kB (p65 subunit) in U87 GBM cells and evaluation of miR-21 expression, proliferation and viability in U87, U87-anti-miR-21 and U87-GFP GBM cells after incubation with sunitinib. Twenty-four hours after cell transfection with scrambled (Scr) or anti-miR-21 oligonucleotides, at a final concentration of 100 nm, cells were exposed to 15 μm sunitinib (SUN 15 μm) for 24 h, rinsed with PBS, after which nuclear extracts were prepared. (A) Representative gel showing p65 levels in U87 cells 48 h after transfection with anti-miR-21 or scrambled (Scr) oligonucleotides (n = 3) at a final oligonucleotide concentration of 100 nm, either per se or in combination with exposure to 15 μm sunitinib. (B) Quantification of p65 bands observed in (A), corrected for individual histone H3 signal intensity. *P < 0.05 when compared with control untreated U87 cells. Modified U87 cell lines, expressing either an anti-miR-21 short hairpin (U87-anti-miR-21) or a GFP-coding short hairpin (U87-GFP), were developed as described in the Materials and Methods section. (A) miR-21 and miR-128 expression in U87-anti-miR-21 and U87-GFP cells, normalized to the reference U6snRNA. Results are presented as relative expression values to control U87 cells. Two-way analysis of variance combined with the Bonferroni posthoc test was used for statistical analysis. ***P < 0.001 when compared with U87-GFP cells. (B) U87, U87-anti-miR-21 and U87-GFP cells were plated onto 48-well plates at a density of 2.5 × 10⁴ cells/well. At defined time points, cells were washed with PBS, trypsinized and resuspended in culture medium. The number of viable cells was determined by Trypan blue exclusion. Two-way analysis of variance combined with the Bonferroni posthoc test was used for statistical analysis. **P < 0.01, ***P < 0.001 when compared with U87-GFP cells. (C) Twenty-four hours before incubation with sunitinib, cells were plated onto 24-well plates at a concentration of 5 × 10⁴ cells/well. Cells were exposed to different concentrations of sunitinib for 24 h and further grown for 24 h in fresh culture medium, after which the cell viability was evaluated by the Alamar Blue assay (as described in the Materials and Methods section). Two-way analysis of variance combined with Bonferroni's posthoc test was used for statistical analysis. #P < 0.001 when compared with U87 cells.

Similar articles

Cited by

References

    1. Stupp R., Mason W.P., van den Bent M.J., Weller M., Fisher B., Taphoorn M.J., Belanger K., Brandes A.A., Marosi C., Bogdahn U., et al. Radiotherapy plus concomitant and adjuvant temozolomide for glioblastoma. N. Engl. J. Med. 2005;352:987–996. - PubMed
    1. Khasraw M., Lassman A.B. Advances in the treatment of malignant gliomas. Curr. Oncol. Rep. 2010;12:26–33. - PubMed
    1. Stupp R., Hegi M.E., Mason W.P., van den Bent M.J., Taphoorn M.J., Janzer R.C., Ludwin S.K., Allgeier A., Fisher B., Belanger K., et al. Effects of radiotherapy with concomitant and adjuvant temozolomide versus radiotherapy alone on survival in glioblastoma in a randomised phase III study: 5-year analysis of the EORTC-NCIC trial. Lancet Oncol. 2009;10:459–466. - PubMed
    1. Bartel D.P., Chen C.Z. Micromanagers of gene expression: the potentially widespread influence of metazoan microRNAs. Nat. Rev. Genet. 2004;5:396–400. - PubMed
    1. Guo H., Ingolia N.T., Weissman J.S., Bartel D.P. Mammalian microRNAs predominantly act to decrease target mRNA levels. Nature. 2010;466:835–840. - PMC - PubMed

Publication types

MeSH terms