Comparative Study
. 2012 Sep 28;4(10):1367-81.
doi: 10.3390/nu4101367.

Differential development of glucose intolerance and pancreatic islet adaptation in multiple diet induced obesity models

Affiliations
Comparative Study

Differential development of glucose intolerance and pancreatic islet adaptation in multiple diet induced obesity models

Bilal Omar et al. Nutrients. .

Abstract

Background: The C57BL/6 mouse fed a high fat diet is a common and valuable model in experimental studies of obesity and type 2 diabetes (T2D). Different high fat diets are used and in order to determine which diet produces a model most accurately resembling human T2D, they need to be compared head-to-head.

Methods: Four different diets, the 60% high fat diet (HFD) and the 58% high fat-high sucrose Surwit diet (HFHS) and their respective controls, were compared in C57BL/6J mice using glucose tolerance tests (IVGTT) and the euglycemic clamp.

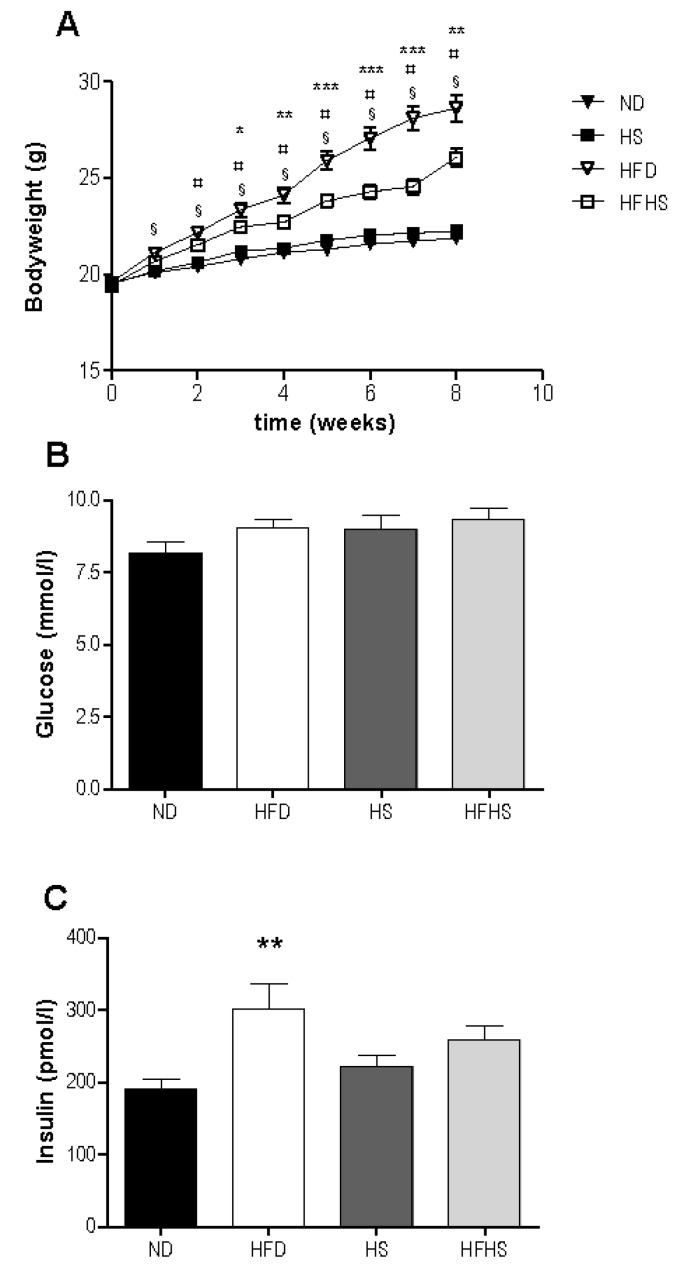
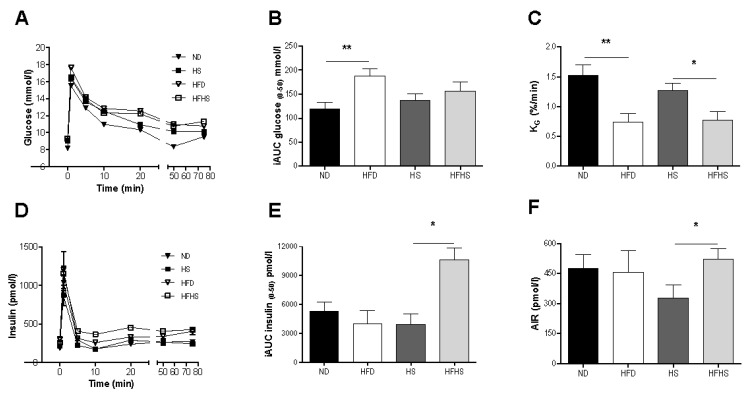
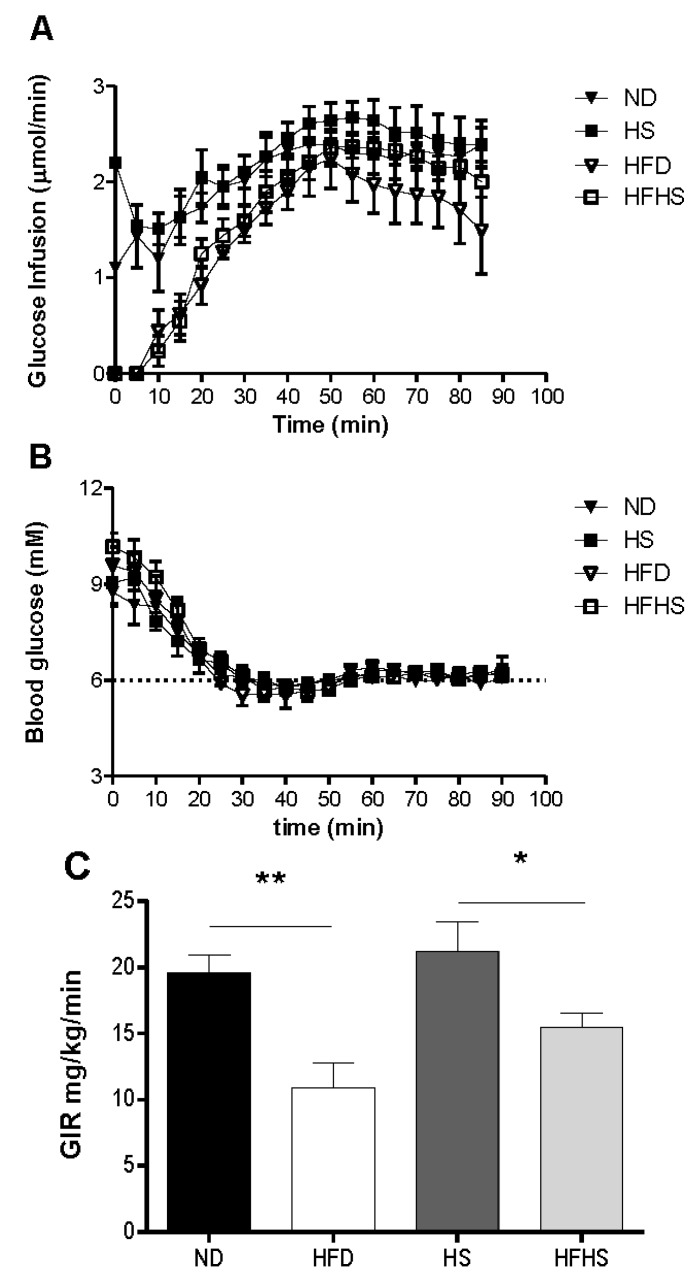
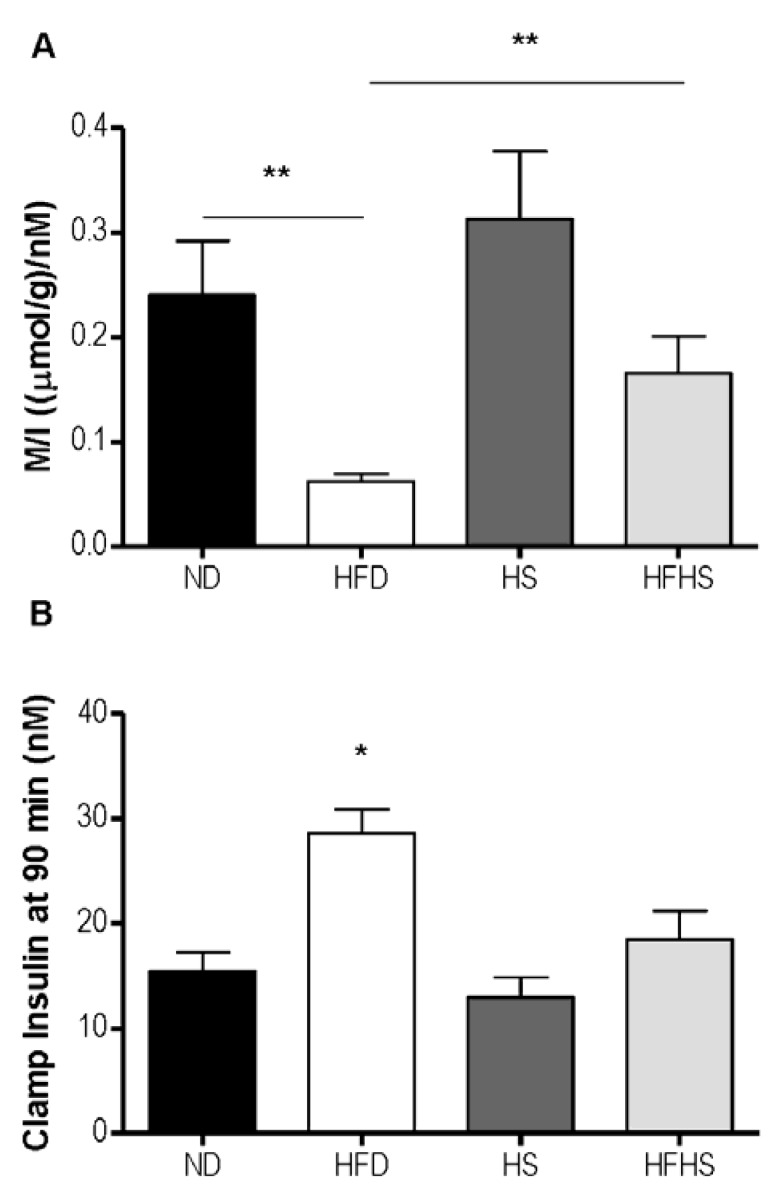
Results: Mice fed a HFD gained more weight than HFHS fed mice despite having similar energy intake. Both high fat diet models were glucose intolerant after eight weeks. Mice fed the HFD had elevated basal insulin, which was not seen in the HFHS group. The acute insulin response (AIR) was unchanged in the HFD group, but slightly increased in the HFHS diet group. The HFHS diet group had a threefold greater total insulin secretion during the IVGTT compared to its control, while no differences were seen in the HFD group. Insulin sensitivity was decreased fourfold in the HFD group, but not in the HFHS diet group.

Conclusion: The HFD and HFHS diet models show differential effects on the development of insulin resistance and beta cell adaptation. These discrepancies are important to acknowledge in order to select the appropriate diet for specific studies.


Figures

Figure 1
Figure 1
Weight gain and basal blood glucose and insulin, (A) Bodyweight was measured once weekly for the 8 week study period. n = 34 per diet group, § p < 0.001 normal rodent diet (ND) vs. high fat diet (HFD), ¤ p < 0.01 high sucrose control diet (HS) vs. high fat-high sucrose Surwit diet (HFHS), * p < 0.05, ** p < 0.01, *** p < 0.001 HFD vs. HFHS. Blood samples were taken from the retrobulbar intraorbital plexus after a 5 h fast and plasma was assayed for glucose (B) and insulin (C). n = 11–12 per diet group, ** p < 0.01.
Figure 2
Figure 2
Intravenous glucose tolerance tests (IVGTT). 0.35g/kg bw D-glucose was injected into the tail vein and blood was sampled from the retrobulbar intraorbital plexus at 0, 1, 5, 10, 20, 50 and 75 min. (A) Plasma glucose concentrations during the IVGTT. (B) Incremental area under the curve for glucose from 0 to 50 min after the glucose injection. (C) The glucose elimination constant KG was determined as the rate of change in the logarithmic glucose concentration between 5 and 20 min after the glucose injection. (D) Plasma insulin concentrations during the IVGTT. (E) Incremental area under the curve (AUC) for insulin from 0 to 50 min after the glucose injection. (F) The acute insulin response (AIR) calculated as the mean of the suprabasal 1 and 5 min plasma insulin values. n = 11–12 per diet group, * p < 0.05, ** p < 0.01.
Figure 3
Figure 3
Relationship between insulin secretion and glucose clearance. Linear regressions between the glucose elimination rate (KG) and the acute insulin response (ΔAIR) for the normal and high fat diet groups (A) and the Surwit high sucrose and high-fat high sucrose diet groups (B). n = 11–12 per group.
Figure 4
Figure 4
Insulin sensitivity determined by euglycemic-hyperinsulinemic clamp. Anesthetized mice received continuous infusion of insulin (15 mU kg−1·min−1) and variable infusion of glucose to maintain blood glucose between 5.5 and 6.5 mM. (A) The glucose infusion rate for the entire 90 min. (B) The blood glucose concentration during the 90 min clamp. (C) The mean glucose infusion rate (GIR) for the 60–90 min steady state. n = 6–7 per group.
Figure 5
Figure 5
The M/I index derived from the euglycemic-hyperinsulinemic clamp. (A) M/I expressed as the ratio of glucose infused (M) to the plasma concentration of insulin (I) at the end of the clamp experiment (90 min). (B) The plasma insulin concentration at 90 min. n = 6–7 per group, * p < 0.05, ** p < 0.01.

Similar articles

Cited by

References

    1. Wild S., Roglic G., Green A., Sicree R., King H. Global prevalence of diabetes: Estimates for the year 2000 and projections for 2030. Diabetes Care. 2004;27:1047–1053. doi: 10.2337/diacare.27.5.1047. - DOI - PubMed
    1. Guh D.P., Zhang W., Bansback N., Amarsi Z., Birmingham C.L., Anis A.H. The incidence of co-morbidities related to obesity and overweight: A systematic review and meta-analysis. BMC Public Health. 2009;9:88. doi: 10.1186/1471-2458-9-88. - DOI - PMC - PubMed
    1. Boden G., Shulman G.I. Free fatty acids in obesity and type 2 diabetes: Defining their role in the development of insulin resistance and beta-cell dysfunction. Eur. J. Clin. Invest. 2002;32:14–23. - PubMed
    1. Kahn S.E. The relative contributions of insulin resistance and beta-cell dysfunction to the pathophysiology of type 2 diabetes. Diabetologia. 2003;46:3–19. - PubMed
    1. Ritzel R.A., Butler A.E., Rizza R.A., Veldhuis J.D., Butler P.C. Relationship between beta-cell mass and fasting blood glucose concentration in humans. Diabetes Care. 2006;29:717–718. - PubMed

Publication types

MeSH terms