Comparative Study
. 2013 Jan;16(1):25-32.
doi: 10.1038/nn.3277. Epub 2012 Dec 2.

Evolution of GluN2A/B cytoplasmic domains diversified vertebrate synaptic plasticity and behavior

Affiliations
Comparative Study

Evolution of GluN2A/B cytoplasmic domains diversified vertebrate synaptic plasticity and behavior

Tomás J Ryan et al. Nat Neurosci. 2013 Jan.

Erratum in

  • Nat Neurosci. 2013 Dec;16(12):1908

Abstract

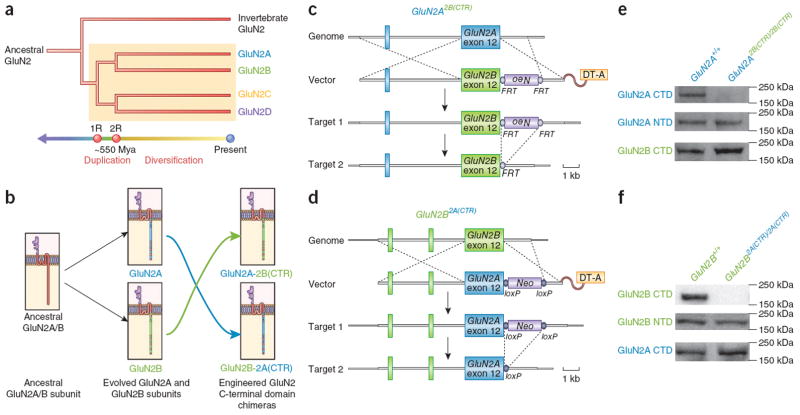
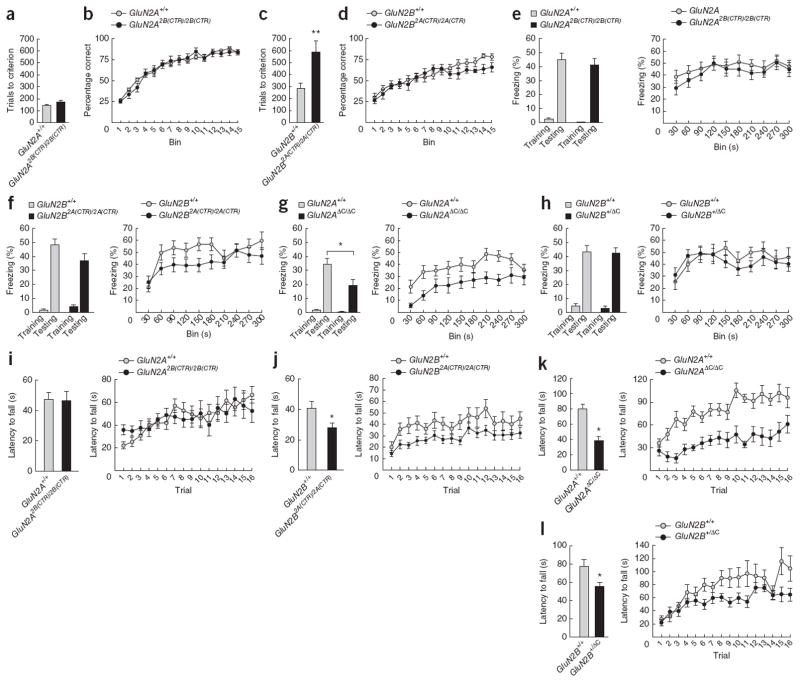
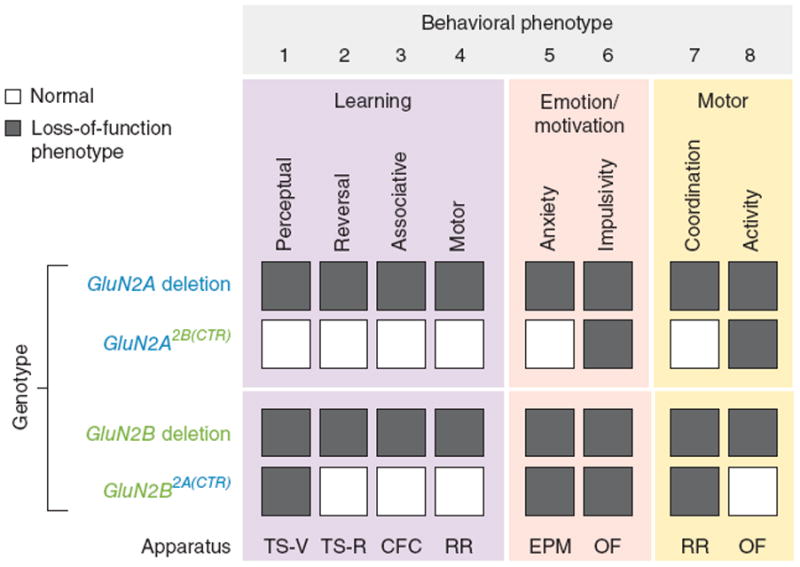
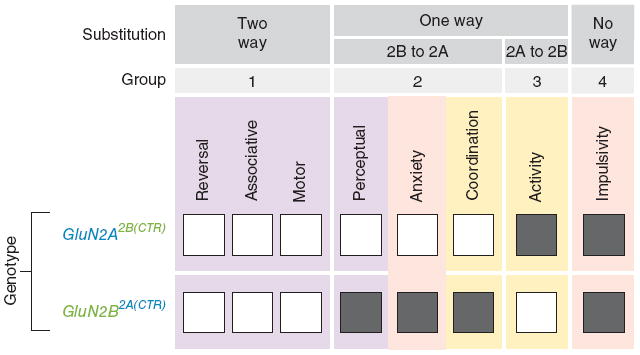
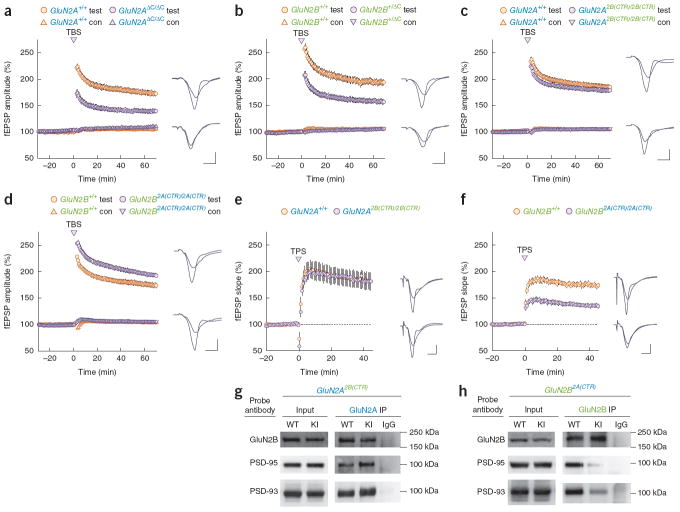
Two genome duplications early in the vertebrate lineage expanded gene families, including GluN2 subunits of the NMDA receptor. Diversification between the four mammalian GluN2 proteins occurred primarily at their intracellular C-terminal domains (CTDs). To identify shared ancestral functions and diversified subunit-specific functions, we exchanged the exons encoding the GluN2A (also known as Grin2a) and GluN2B (also known as Grin2b) CTDs in two knock-in mice and analyzed the mice's biochemistry, synaptic physiology, and multiple learned and innate behaviors. The eight behaviors were genetically separated into four groups, including one group comprising three types of learning linked to conserved GluN2A/B regions. In contrast, the remaining five behaviors exhibited subunit-specific regulation. GluN2A/B CTD diversification conferred differential binding to cytoplasmic MAGUK proteins and differential forms of long-term potentiation. These data indicate that vertebrate behavior and synaptic signaling acquired increased complexity from the duplication and diversification of ancestral GluN2 genes.


Figures

Figure 1
Figure 1
Design and generation of mouse models a phylogeny illustrating the invertebrate GluN2 and four vertebrate GluN2 paralogs (GluN2A, GluN2B, GluN2C and GluN2D). (a) Two pairs of vertebrate GluN2 genes can be identified, reflecting their evolutionary origins in the two rounds of whole genome duplication (1R, 2R) at the base of the chordate lineage ~550 million years ago (Mya). Yellow box highlights the four vertebrate GluN2 proteins. (b) Schematic depicting the homology (common origin) of the GluN2A and GluN2B subunit. The ancestral subunit to GluN2A and GluN2B was duplicated during the 2R event, creating two GluN2 paralogs that diversified into GluN2A and GluN2B. The cytoplasmic CTDs are the most divergent regions of the GluN2A and GluN2B proteins (Supplementary Fig. 1). CTD regions unique to GluN2A and GluN2B are colored blue and green, respectively. CTD regions that are homologous (common) between GluN2A and GluN2B are colored red (29% of the GluN2A/B CTD amino acid sequences). For brevity, divergent regions of the GluN2A/B extracellular and transmembrane regions are not marked. The engineered GluN2A2B(CTR) and GluN2B2A(CTR) chimeric subunits are depicted beside the respective endogenous murine GluN2 subunits. (c) The GluN2A2B(CTR) allele encodes a chimeric GluN2A subunit consisting of GluN2A extracellular and transmembrane regions and the GluN2B CTD. The terminal GluN2A exon that encodes the CTD was replaced with the paralogous sequence from GluN2B (target 1). The FRT-flanked Neo selection cassette was placed in the GluN2A 3′ UTR and was removed by crossing GluN2A2B(CTR)/+ mice with CAG-FLP recombinase transgenic mice (target 2). (d) The GluN2B2A(CTR) allele encodes a chimeric GluN2B subunit consisting of a GluN2B extracellular and transmembrane regions and the GluN2A CTD. The terminal GluN2B exon that encodes the CTD was replaced with the paralogous sequence from GluN2A (target 1). The loxP-flanked Neo selection cassette was placed in the GluN2B 3′ UTR and was removed by crossing GluN2B2A(CTR)/+ mice with CMV-Cre recombinase transgenic mice (target 2). (e) Western blots of whole forebrain extracted protein, probing for the GluN2A N-terminal domain and CTD, and the GluN2B CTD. No change in apparent protein levels was seen for the GluN2A N-terminal domain in GluN2A2B(CTR)/2B(CTR) mice. No GluN2A CTD signal was detected in GluN2A2B(CTR)/2B(CTR) brain. Probing for the GluN2B CTD revealed an apparent increase in signal in GluN2A2B(CTR)/2B(CTR) mice and a trend toward increased GluN2B CTD signal (normalized to GluN2A N-terminal domain signal) (t4 = 2.9, P > 0.05). (f) Western blots of whole forebrain extracted protein, probing for the GluN2B N-terminal domain and CTD, and the GluN2A CTD. No change in protein levels was seen for the GluN2B N-terminal domain in GluN2B2A(CTR)/2A(CTR) protein extract. No GluN2B CTD signal was detected in GluN2B2A(CTR)/2A(CTR) brain extract. Probing for the GluN2A CTD revealed a significant increase in signal for the GluN2A CTD (normalized to GluN2B N-terminal domain signal) in GluN2B2A(CTR)/2A(CTR) protein extract (t4 = 6.2, P < 0.01).
Figure 2
Figure 2
NMDAR channel physiology. NMDAR-mediated EPSCs were measured in GluN2A2B(CTR)/2B(CTR), GluN2B2A(CTR)/2A(CTR) and GluN2B+/ΔC mice, and in associated wild-type controls. Bar charts show NMDAR/AMPA receptor (AMPAR) ratios for evoked EPSCs recorded at postsynaptic holding potentials of −80 mV or +40 mV and the time constants of the decay of EPSCs evoked at +40 mV. Traces show examples of evoked EPSCs at both holding potentials. GluN2AΔC/ΔC data were published previously42. (a) Results from GluN2A2B(CTR)/2B(CTR) cells (n = 12, N = 3) compared with GluN2A+/+ cells (n = 13, N = 3). (b) Results from GluN2B2A(CTR)/2A(CTR) cells (n = 24, N = 5) compared with GluN2B+/+ cells (n = 28, N = 5). (c) Results from GluN2B+/ΔC cells (n = 21, N = 4) compared with GluN2B+/+ cells (n = 17, N = 5). n represents the number of slices that we used and N represents the number of mice. Error bars represent s.e.m.
Figure 3
Figure 3
Learning behavior. (a–d) Perceptual learning and reversal learning in GluN2A2B(CTR)/2B(CTR) and GluN2B2A(CTR)/2A(CTR) mice, as measured by performance in visual discrimination and subsequent reversal learning (percentage correct trials across 15 bins of 30 reversal trials) in a touchscreen operant conditioning task. **P < 0.01. (a) The total number of trials required to reach acquisition criterion was the same for GluN2A2B(CTR)/2B(CTR) mice (n = 9) and GluN2A+/+ controls (n = 11) (t18 = −1.75, p = 0.1). (b) We saw no significant interaction of bin and genotype (F1,13.9 = 153.3, P = 0.1) and no significant main effect (F1,18 = 0.2, p > 0.8) between GluN2A2B(CTR)/2B(CTR) mice and controls. (c) GluN2B2A(CTR)/2A(CTR) mice (n = 8) required significantly more trials to reach criterion than GluN2B+/+ controls (n = 10) (t16 = −3.12, P < 0.01). (d) We saw no significant interaction of bin and genotype (F1,8,2 = 0.68, P > 0.4) and no significant main effect (F1,13 = 1.69, P > 0.2) between GluN2B2A(CTR)/2A(CTR) mice and controls. (e–h) Associative learning in GluN2A2B(CTR)/2B(CTR), GluN2B2A(CTR)/2A(CTR), GluN2AΔC/ΔC and GluN2B+/ΔC mice, as measured by performance in a contextual fear conditioning task. Left, freezing over a 150-s period before unconditioned stimulus presentation (shock) on training day, and for 180 s on testing 24 h after training. Right, freezing over 300 s of testing. There were no significant effects in baseline freezing on training days for any mutant (data not shown). *P < 0.05. (e) GluN2A2B(CTR)/2B(CTR) mice (n = 21) showed equivalent freezing to GluN2A+/+ controls (n = 22) (t41 = 0.43, P = 0.1). (f) GluN2B2A(CTR)/2A(CTR) mice (n = 21) showed equivalent freezing to GluN2B+/+ controls (n = 19) (t38 = 1.7, P > 0.1). (g) GluN2AΔC/ΔC mice (n = 11) showed significantly less freezing than GluN2A+/+ controls (n = 19) (t28 = 2.2, P < 0.05). (h) GluN2BΔC/+ mice (n = 15) showed equivalent freezing to GluN2B+/+ controls (n = 10) (t23 = 0.14, P > 0.8). (i–l) Motor learning and coordination of GluN2A2B(CTR)/2B(CTR), GluN2B2A(CTR)/2A(CTR), GluN2AΔC/ΔC and GluN2B+/ΔC mice, as measured by performance in the accelerated rotarod. Performance was measured as average latency to fall (s) over eight morning trials (1–8) and eight afternoon trials (9–16). Motor learning deficits were determined by significant interactions of trial and genotype for each session. (i) We found no difference in motor coordination between GluN2A2B(CTR)/2B(CTR) mice (n = 20) and GluN2A+/+ controls (n = 21) (F1,39 = 0.01, P > 0.9), but did find a significant interaction of trial and genotype for the first session (trials 1–8) (F7,273 = 2.1, P < 0.05)—although this was due to enhanced performance on initial trials—but not in the second session (trials 9–16) (F5.4,208.7 = 1.5, P > 0.1). (j) GluN2B2A(CTR)/2A(CTR) mice (n = 21) showed impaired motor coordination relative to GluN2B+/+ controls (n = 19) (F1,38 = 5.1, P < 0.05), but an equivalent rate of improvement across both the first (F4.5,171.5 = 0.65, P > 0.6) and second (F7,266 = 0.4, P > 0.9) sessions. (k) GluN2AΔC/ΔC mice (n = 11) showed impaired motor coordination relative to GluN2A+/+ controls (n = 19) (F1,28 = 20.1, P < 0.0001) and showed reduced motor learning for the first session (F7,196 = 2.1, P < 0.05), but not for the second session (F4.6,130 = 0.7, P > 0.5). (l) GluN2B+/ΔC mice (n = 15) showed impaired motor coordination relative to GluN2B+/+ controls (n = 10) (F1,23 = 6.8, P < 0.02) and a nonsignificant trend toward impaired motor learning over both the first (F7,161 = 1.5, P > 0.1) and second (F3.5,80.2 = 1.6, P > 0.1) sessions. All data are mean±s.e.m.
Figure 4
Figure 4
Emotion/motivation and motor behavior. (a) GluN2A2B(CTR)/2B(CTR) mice (n = 21) showed normal anxiety behavior relative to GluN2A+/+ controls (n = 22) (t41 = −1.49, P > 0.1). (b) GluN2B2A(CTR)/2A(CTR) mice (n = 21) showed significantly less anxiety than GluN2B+/+ controls (n = 19) (U = 70.5, P < 0.001). (c) GluN2AΔC/ΔC mice (n = 11) showed significantly less anxiety than GluN2A+/+ controls (n = 19) (U = 44.5, P = 0.01). (d) GluN2B+/ΔC mice (n = 15) showed normal anxiety relative to GluN2B+/+ controls (n = 10) (t23 = 0.5, P > 0.6). (e–h) Motor activity measured as total distance travelled (cm) in the open field over a 5-min period. (e) GluN2A2B(CTR)/2B(CTR) mice (n = 13) showed significantly more motor activity than GluN2A+/+ controls (n = 14) (t25 = −2.5, P < 0.05). (f) GluN2B2A(CTR)/2A(CTR) mice (n = 21) showed normal motor activity relative to GluN2B+/+ controls (n = 19) (t29.9 = 0.18, P > 0.8). (g) GluN2AΔC/ΔC mice (n = 11) showed significantly more motor activity than GluN2A+/+ controls (n = 19) (t28 = −3, P < 0.01). (h) GluN2B+/ÄC mice (n = 15) showed significantly more motor activity than GluN2B+/+ controls (n = 10) (t23 = −3.5, P < 0.005). (i–l) Impulsivity measured as latency to first enter the inner zone of the open field (s). (i) GluN2A2B(CTR)/2B(CTR) mice (n = 13) showed significantly more impulsivity than GluN2A+/+ controls (n = 14) (U = 41, P < 0.05). (j) GluN2B2A(CTR)/2A(CTR) mice (n = 21) showed significantly more impulsivity than GluN2B+/+ controls (n = 19) (U = 95, P < 0.005). (k) GluN2AÄC/ÄC mice (n = 11) showed significantly more impulsivity than GluN2A+/+ controls (n = 19) (t28 = 2.4, P < 0.05). (l) GluN2B+/ÄC mice (n = 15) showed normal impulsivity relative to GluN2B+/+ controls (n = 10) (t23 = 1.4, P > 0.1). *P < 0.05. All data are mean±s.e.m.
Figure 5
Figure 5
Summary of behavioral phenotypes caused by GluN2 CTD deletion and swap mutations. Summary of behavioral phenotypes resulting from GluN2 CTD deletion and swap mutations. Shown are GluN2 mutant phenotypes in eight behavioral measures deduced from six experimental procedures. The NMDAR-dependent behavioral repertoire investigated was grouped into three boxes encompassing learning behavior (purple), emotion and motivation (beige), and motor behavior (orange). Four forms of learning behavior were assayed: perceptual, reversal, associative and motor. Anxiety and impulsivity measures were used to study emotional and motivational function. Motor coordination and motor activity were used to study basic motor function. The behavioral assays that we employed included touchscreen-based visual discrimination (TS-V), touchscreen-based reversal learning (TS-R), contextual fear conditioning (CFC), accelerating rotarod (RR), elevated plus maze (EPM) and open field (OF). Shaded boxes denote loss-of-function mutant phenotypes for a given measure and white boxes denote normal behavior in mutants. All eight behavioral phenotypes that we considered required both GluN2A and GluN2B. Genetic disruption of either GluN2A or GluN2B resulted in impairments in all eight of the behavioral measures. The GluN2A2B(CTR)/2B(CTR) mice showed loss-of-function phenotypes only for impulsivity and activity. The GluN2B2A(CTR)/2A(CTR) mice showed loss-of-function phenotypes for perceptual learning, anxiety, impulsivity and motor coordination.
Figure 6
Figure 6
Evolutionary grouping of behavioral phenotypes. We grouped mutant phenotypes found in GluN2A2B(CTR)/2B(CTR) and GluN2B2A(CTR)/2A(CTR) mice according to the observed substitution grouping. If a behavioral phenotype was normal in both GluN2A2B(CTR)/2B(CTR) and GluN2B2A(CTR)/2A(CTR) mice, then it required only ancestral (conserved) regions of GluN2A/B CTDs and was classified as a two-way substitution (group 1). If a behavioral phenotype was altered in only one of the two chimeric mutants, then it was classified as a one-way substitution. 2B to 2A one-way substitutions are phenotypes that required CTD regions unique to GluN2B, but not GluN2A (group 2). 2A to 2B one-way substitutions are phenotypes that required CTD regions unique to GluN2A, but not GluN2B (group 3). If a behavioral phenotype was altered in both the GluN2A2B(CTR)/2B(CTR) and GluN2B2A(CTR)/2A(CTR) mice, then it required CTD regions unique to both GluN2A and GluN2B and was classified as a no-way substitution (group 4).
Figure 7
Figure 7
Synaptic plasticity. Example fEPSPs recorded during baseline and 65 minutes after LTP induction in wild type (top) and mutant mice (bottom) are shown to the right in a–d. Calibration bars are 3 msec and 1 mV. Test, test pathway; con, control pathway. (a) Theta-burst induced LTP was significantly impaired (F(1,30) = 33.14, P < 0.0001) in GluN2AΔC/ΔC mice (129.9 ± 3.4%; n = 18, N = 5) compared to GluN2A+/+ mice (167.0 ± 4.5%; n = 25, N = 8). (b) Heterozygous truncation of the GluN2B CTR led to a significant decrease in theta-burst induced LTP (F(1,37) = 26.66, P < 0.0001) in GluN2B+/ΔC mice (148.9 ± 4.5%; n = 32, N = 10) compared to GluN2B+/+ mice (183.6 ± 5.6%; n = 21, N = 6). (c) Theta-burst induced LTP was intact in mice where the endogenous CTD of GluN2A protein was replaced with the CTD from GluN2B (F(1,39) = 1.60, P > 0.2). (d) Replacement of the endogenous CTD of GluN2B protein with the CTD from GluN2A led to a small but significant up-regulation of theta-burst induced LTP (F(1,39) = 6.67, P = 0.01) in GluN2B2A(CTR)/2A(CTR) (183.8 ± 4%; n = 34, N = 10) compared to GluN2B+/+ mice (169.6 ± 4.3%; n = 24, N = 9). (e) Theta pulse stimulation (TPS, 5 Hz/30 sec)-induced LTP was normal in GluN2A2B(CTR)/2B(CTR) mice t(9) = 0.041, P > 0.9). 45 minutes post-TPS fEPSPs were potentiated to (182 ± 6.4%; n = 12, N = 6) of baseline in slices from GluN2A2B(CTR)/2B(CTR) mice compared (182 ± 16%; n = 9, N = 5) of baseline in slices from GluN2A+/+ mice. (f) TPS-induced LTP was reduced in GluN2B2A(CTR)/2A(CTR) mutants t(12) = 6.76, P < 0.001. fEPSPs were potentiated to (135 ± 3.9%; n = 17, N = 7) of baseline in slices from GluN2B2A(CTR)/2A(CTR) mice compared to (172 ± 3.9%; n = 13, N = 7) of baseline in slices from GluN2B+/+ mice. Calibration bars in e and f represent 4 msec and 2 mV. (g) Normal levels of the MAGUK proteins were found in the input GluN2A2B(CTR)/2B(CTR) mice (PSD-95: t4 = 1.04; P > 0.3; PSD-93: t4 = 0.21; P > 0.8). Significant increases in PSD-95 (t3 = 13.1; P < 0.001) and PSD-93 (t4 = 4.1; P < 0.05) association were pulled down with the GluN2A2B(CTR) chimeric receptors. No significant difference in GluN2B protein was observed in the GluN2A2B(CTR)/2B(CTR) pull-downs (t4 = −0.3; P = 0.8). (h) Normal levels of the MAGUK proteins were found in the input of GluN2B2A(CTR)/2A(CTR) mice (PSD-95: t4 = −0.83, P > 0.4; PSD-93: t4 = −0.02, P > 0.9). Significantly reduced quantities of each of the two NMDAR-binding MAGUKs were pulled down with the GluN2B2A(CTR) chimeric receptor (PSD-95: t4 = −6.7, P < 0.01; PSD-93: t4 = −3.26, P < 0.05). No significant difference in GluN2B protein was observed in the GluN2B2A(CTR)/2A(CTR) pull-downs (t4 = −0.05, P > 0.9). n represents the number of slices that we used and N represents the number of mice.

Comment in

References

    1. Kandel ER. The molecular biology of memory storage: a dialogue between genes and synapses. Science. 2001;294:1030–1038. - PubMed
    1. LeDoux JE. Synaptic Self: How Our Brains Become Who We Are. Viking Press; 2002.
    1. Margulies C, Tully T, Dubnau J. Deconstructing memory in Drosophila. Curr Biol. 2005;15:R700–713. - PMC - PubMed
    1. Xia S, et al. NMDA receptors mediate olfactory learning and memory in Drosophila. Curr Biol. 2005;15:603–615. - PMC - PubMed
    1. Glanzman DL. Common mechanisms of synaptic plasticity in vertebrates and invertebrates. Curr Biol. 2010;20:R31–36. - PMC - PubMed

Publication types

MeSH terms

Substances

LinkOut - more resources