. 2013 Jan;45(1):104-8.
doi: 10.1038/ng.2471. Epub 2012 Dec 2.

MCT1-mediated transport of a toxic molecule is an effective strategy for targeting glycolytic tumors

Affiliations

MCT1-mediated transport of a toxic molecule is an effective strategy for targeting glycolytic tumors

Kivanç Birsoy et al. Nat Genet. 2013 Jan.

Abstract

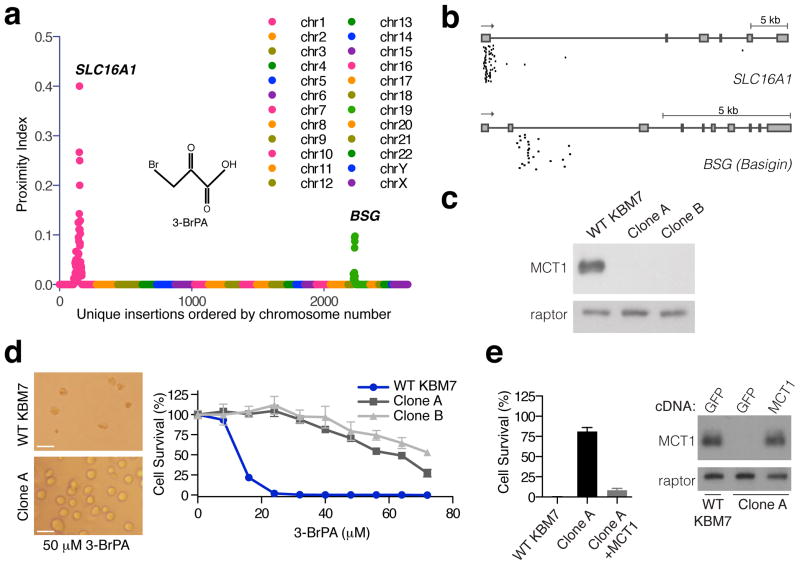
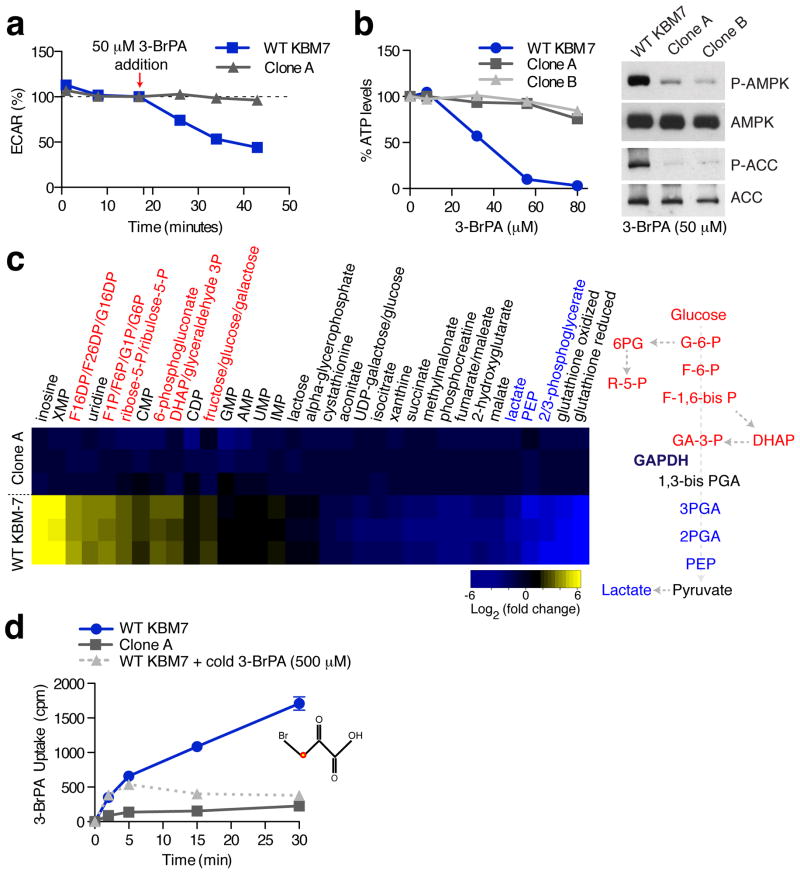
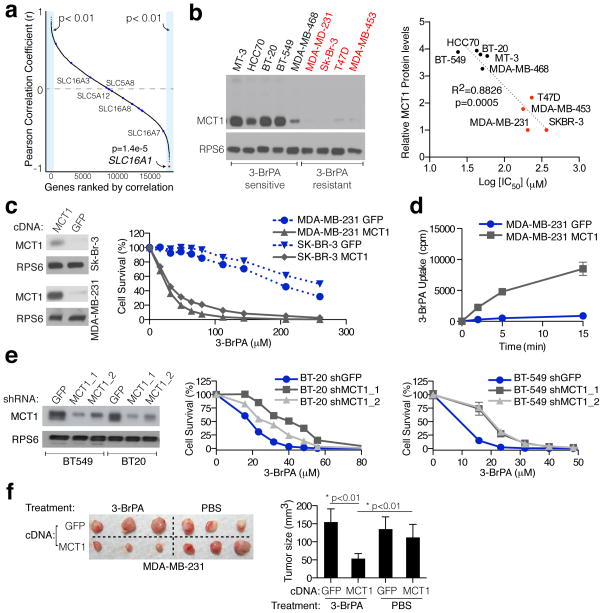
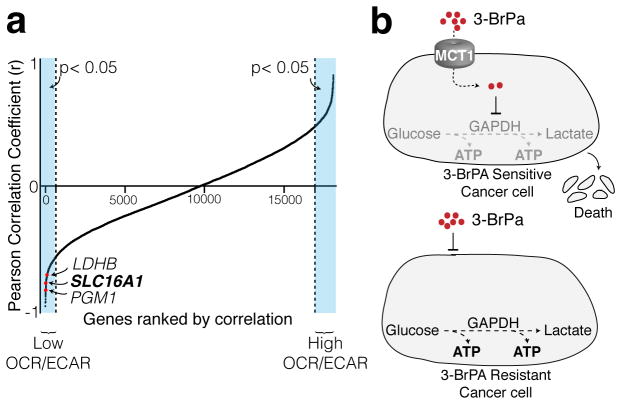
There is increasing evidence that oncogenic transformation modifies the metabolic program of cells. A common alteration is the upregulation of glycolysis, and efforts to target glycolytic enzymes for anticancer therapy are under way. Here, we performed a genome-wide haploid genetic screen to identify resistance mechanisms to 3-bromopyruvate (3-BrPA), a drug candidate that inhibits glycolysis in a poorly understood fashion. We identified the SLC16A1 gene product, MCT1, as the main determinant of 3-BrPA sensitivity. MCT1 is necessary and sufficient for 3-BrPA uptake by cancer cells. Additionally, SLC16A1 mRNA levels are the best predictor of 3-BrPA sensitivity and are most elevated in glycolytic cancer cells. Furthermore, forced MCT1 expression in 3-BrPA-resistant cancer cells sensitizes tumor xenografts to 3-BrPA treatment in vivo. Our results identify a potential biomarker for 3-BrPA sensitivity and provide proof of concept that the selectivity of cancer-expressed transporters can be exploited for delivering toxic molecules to tumors.


Figures

Figure 1
Figure 1. Haploid cell genetic screening identifies MCT1 as required for 3-BrPA sensitivity
(a) Mutagenized KBM7 cells were treated with 3-BrPA and resistant clones were pooled. Gene–trap insertion sites were identified by massively parallel sequencing and mapped to the human genome. The Y-axis represents the proximity index, a measure of the local density of insertions. The X-axis represents the insertion sites ordered by their genomic position. (b) Map of unique insertion sites in the SLC16A1 (MCT1) and BSG (Basigin) genes in the surviving cell population. Boxes denote exons. (c) Immunoblotting for MCT1 protein in two clonally derived cell lines containing gene trap insertions in SLC16A1 (Clone A and B). (d) Resistance of MCT1-null KBM7 clones to 3-BrPA (50 μM) compared to wild type KBM7 cells. Microscopic analysis (Left) and survival curves (Right) of wild type and MCT1-null KBM7 cells after 3 days of 3-BrPA treatment. Error bars are ± SEM. Scale bar, 20 microns. (e) Exogenous expression of MCT1 in MCT1-null KBM7 cells restores their sensitivity to 3-BrPA. Error bars are ± SEM (n = 3).
Figure 2
Figure 2. MCT1-null cells are immune to the metabolic effects of 3-BrPA and do not transport it
(a) Extracellular Flux Analysis of wild type and MCT1-null KBM7 cells upon 3-BrPA (50 μM) addition. Changes in ECAR, a proxy for lactate production, were monitored upon the addition of 50 μM 3-BrPA. Results are displayed as a percentage of the ECAR reading immediately before 3-BrPA addition. Error bars are ± SEM (n = 10). (b) Intracellular ATP levels in wild type and MCT1-null KBM7 cells were determined after treatment for 60 minutes with the indicated concentrations of 3-BrPA using a luciferase-based assay. Error bars are ± SEM (n = 6). Immunoblots show phosphorylation status of AMPK and ACC in wild type and MCT1-null KBM7 cell after treatment with 3-BrPA (50 μM). (c) Heat map of relative metabolite changes between wild type and MCT1-null KBM7 cells upon 3-BrPA treatment. Yellow to blue colored bar indicates degree of change (log2) in metabolite abundance relative to MCT1-null KBM7 cells. Cells were cultured for 1 hour with 50 μM 3-BrPA and intracellular metabolites were obtained and analyzed by LC-MS (n = 3). (d) 14C-3-BrPA uptake in MCT1-null and wild type KBM7 cells in the presence/absence of excess unlabeled 3-BrPA (500 μM). Error bars are ± SEM (n = 3). Note that in some instances error bars are too small to see or are hidden by a symbol.
Figure 3
Figure 3. MCT1 expression is the predominant determinant of 3-BrPA sensitivity in cancer cells
(a) The concentration of 3-BrPA at which 50% cell growth inhibition occurred after 3 days of administration (IC50) was determined for 15 cancer cell lines. These values were correlated with transcriptome-wide mRNA expression data from the Cancer Cell Line Encyclopedia (CCLE) and the resulting Pearson correlation coefficients were sorted and plotted. The red dot indicates SLC16A1 (MCT1), whereas blue dots indicate members of MCT and SMCT family of transporters. Names of all members of these families shown to transport lactate are indicated on the plot. (b) Immunoblot shows MCT1 protein levels for 9 different breast cancer cell lines (Left). Relative protein levels correlated with the corresponding IC50 values for 3-BrPA for each cell line (Right). (c) Immunoblot for MCT1 levels in SK-BR-3 and MDA-MB-231 cells expressing a control GFP protein or MCT1 (Left). Survival curves of indicated cell lines expressing the MCT1 cDNA and treated with 3-BrPA (Right). Error bars are ± SEM (n = 3). (d) 14C-3-BrPA uptake in parental and MCT1-overexpressing MDA-MB-231 cells. Error bars are ± SEM (n = 3). (e) Immunoblots and survival curves upon 3-BrPA treatment for indicated cell lines expressing shRNAs targeting a control GFP protein or MCT1 (MCT1_1 and MCT1_2). Error bars are ± SEM (n = 3). (f) Representative photographs (Left) and average weights (Right) of tumors formed by MDA-MB-231 cells expressing the MCT1 or GFP cDNA after 3 weeks of treatment with vehicle or 3-BrPA (8 mg/kg). Error bars are ± SD (n = 5). Note that in some instances error bars are too small to see or are hidden by a symbol.
Figure 4
Figure 4. MCT1 expression correlates with glycolysis upregulation in cancer cells
(a) OCR/ECAR values were determined for 15 cell lines using the Seahorse Extracellular Flux Analyzer. These values were correlated with transcriptome-wide mRNA expression data from the Cancer Cell Line Encyclopedia (CCLE) and the resulting Pearson correlation coefficients were sorted and plotted. (b) Schematic illustration of the toxic cargo delivery strategy using 3-BrPA. Glycolytic cancer cells express high levels of MCT1 and are sensitive to 3-BrPA. Cancer cells with low/no levels of MCT1 are resistant to 3-BrPA.

References

    1. Vander Heiden MG. Targeting cancer metabolism: a therapeutic window opens. Nat Rev Drug Discov. 2011;10:671–684. - PubMed
    1. Thompson CB. Rethinking the Regulation of Cellular Metabolism. Cold Spring Harb Symp Quant Biol. 2012 - PubMed
    1. DeBerardinis RJ, Thompson CB. Cellular metabolism and disease: what do metabolic outliers teach us? Cell. 2012;148:1132–1144. - PMC - PubMed
    1. Tennant DA, Duran RV, Gottlieb E. Targeting metabolic transformation for cancer therapy. Nat Rev Cancer. 2010;10:267–277. - PubMed
    1. Birsoy K, Sabatini DM, Possemato R. Untuning the tumor metabolic machine: Targeting cancer metabolism: a bedside lesson. Nat Med. 2012;18:1022–1023. - PubMed

Publication types