

Immuno-MALDI-MS in human plasma and on-chip biomarker characterizations at the femtomole level
- PMID: 23202203
- PMCID: PMC3522956
- DOI: 10.3390/s121115119
Immuno-MALDI-MS in human plasma and on-chip biomarker characterizations at the femtomole level
Abstract
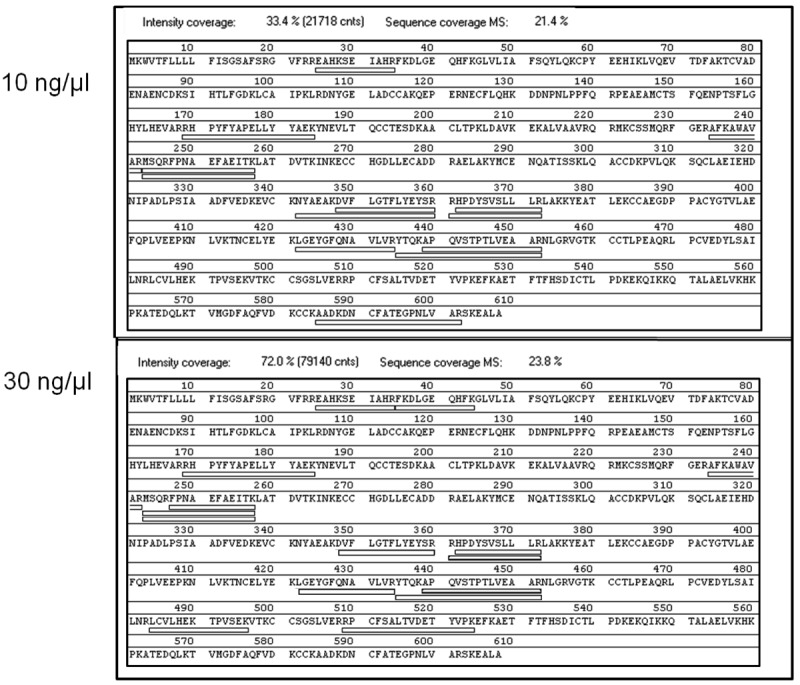
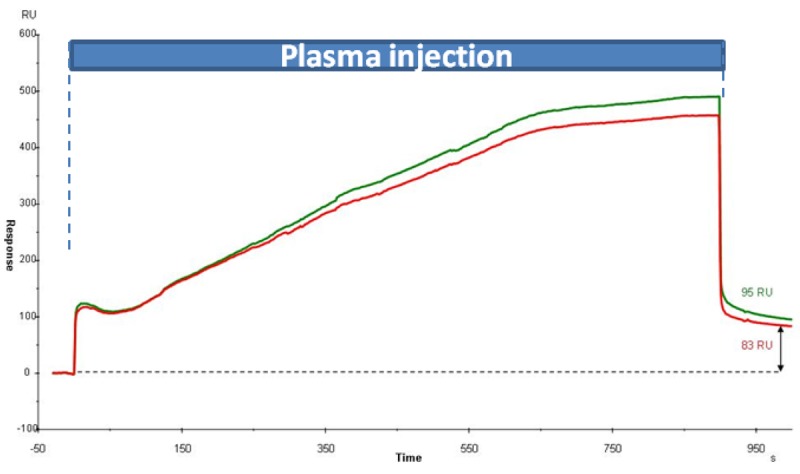
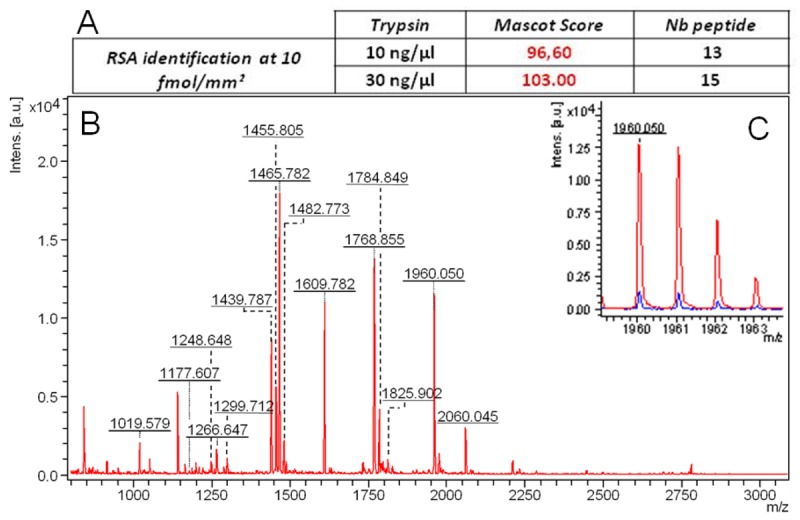
Immuno-SPR-MS is the combination of immuno-sensors in biochip format with mass spectrometry. This association of instrumentation allows the detection and the quantification of proteins of interest by SPR and their molecular characterization by additional MS analysis. However, two major bottlenecks must be overcome for a wide diffusion of the SPR-MS analytical platform: (i) To warrant all the potentialities of MS, an enzymatic digestion step must be developed taking into account the spot formats on the biochip and (ii) the biological relevancy of such an analytical solution requires that biosensing must be performed in complex media. In this study, we developed a procedure for the detection and the characterization at ~1 µg/mL of the LAG3 protein spiked in human plasma. The analytical performances of this new method was established, particularly its specificity (S/N > 9) and sensitivity (100% of LAG3 identification with high significant mascot score >68 at the femtomole level). The collective and automated on-chip MALDI-MS imaging and analysis based on peptidic fragments opens numerous applications in the fields of proteomics and diagnosis.
Figures


Similar articles
-
Surface plasmon resonance imaging in arrays coupled with mass spectrometry (SUPRA-MS): proof of concept of on-chip characterization of a potential breast cancer marker in human plasma.Anal Bioanal Chem. 2012 Aug;404(2):423-32. doi: 10.1007/s00216-012-6130-4. Epub 2012 Jun 15. Anal Bioanal Chem. 2012. PMID: 22699232
-
Hyphenation of surface plasmon resonance imaging to matrix-assisted laser desorption ionization mass spectrometry by on-chip mass spectrometry and tandem mass spectrometry analysis.Anal Chem. 2009 Sep 15;81(18):7695-702. doi: 10.1021/ac901140m. Anal Chem. 2009. PMID: 19678664
-
Biomarkers probed in saliva by surface plasmon resonance imaging coupled to matrix-assisted laser desorption/ionization mass spectrometry in array format.Anal Bioanal Chem. 2015 Feb;407(5):1285-94. doi: 10.1007/s00216-014-8373-8. Epub 2014 Dec 19. Anal Bioanal Chem. 2015. PMID: 25524230
-
Identification and Affinity Determination of Protein-Antibody and Protein-Aptamer Epitopes by Biosensor-Mass Spectrometry Combination.Int J Mol Sci. 2021 Nov 27;22(23):12832. doi: 10.3390/ijms222312832. Int J Mol Sci. 2021. PMID: 34884636 Free PMC article. Review.
-
Advances in coupling microfluidic chips to mass spectrometry.Mass Spectrom Rev. 2015 Sep-Oct;34(5):535-57. doi: 10.1002/mas.21417. Epub 2014 Jan 7. Mass Spectrom Rev. 2015. PMID: 24399782 Review.
Cited by
-
AB186 Inhibits Migration of Triple-Negative Breast Cancer Cells and Interacts with α-Tubulin.Int J Mol Sci. 2022 Jun 20;23(12):6859. doi: 10.3390/ijms23126859. Int J Mol Sci. 2022. PMID: 35743305 Free PMC article.
-
Personalized Proteomics: The Future of Precision Medicine.Proteomes. 2016;4(4):29. doi: 10.3390/proteomes4040029. Epub 2016 Oct 1. Proteomes. 2016. PMID: 27882306 Free PMC article.
-
Whole Cell MALDI Fingerprinting Is a Robust Tool for Differential Profiling of Two-Component Mammalian Cell Mixtures.J Am Soc Mass Spectrom. 2019 Feb;30(2):344-354. doi: 10.1007/s13361-018-2088-6. Epub 2018 Oct 23. J Am Soc Mass Spectrom. 2019. PMID: 30353292 Free PMC article.
References
-
- Sparbier K., Wenzel T., Dihazi H., Blaschke S., Müller G.-A., Deelder A., Flad T., Kostrzewa M. Immuno-MALDI-TOF MS: New perspectives for clinical applications of mass spectrometry. Proteomics. 2009;9:1442–1450. - PubMed
-
- Lopez M.-F., Rezai T., Sarracino D.A., Prakash A., Krastins B., Athanas M., Singh R.-J., Barnidge D.-R., Oran P., Borges C., Nelson R.-W. Selected reaction monitoring-mass spectrometric immunoassay responsive to parathyroid hormone and related variants. Clin. Chem. 2010;56:281–290. - PubMed
-
- Natsume T., Nakayama H., Jansson S., Isobe T., Takio K., Mikoshiba K. Combination of biomolecular interaction analysis and mass spectrometric amino acid sequencing. Anal. Chem. 2000;72:4193–4198. - PubMed
-
- Larsericsdotter H., Jansson O., Zhukov A., Areskou D., Oscarsson S., Buijs J. Optimizing the surface plasmon resonance/mass spectrometry interface for functional proteomics applications: how to avoid and utilize nonspecific adsorption. Proteomics. 2006;6:2355–2364. - PubMed
MeSH terms
Substances
LinkOut - more resources
Full Text Sources
Miscellaneous
