Review
. 2012 Nov 19;12(11):15947-82.
doi: 10.3390/s121115947.

Overview of micro- and nano-technology tools for stem cell applications: micropatterned and microelectronic devices

Affiliations
Review

Overview of micro- and nano-technology tools for stem cell applications: micropatterned and microelectronic devices

Stefano Cagnin et al. Sensors (Basel). .

Abstract

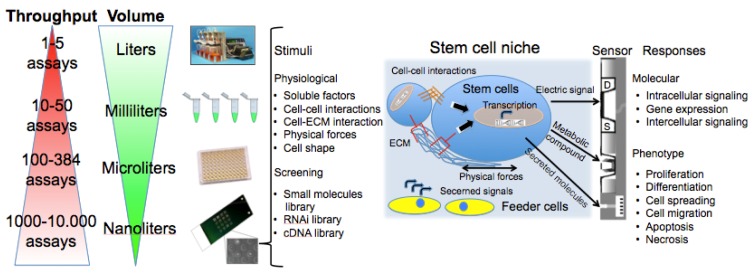
In the past few decades the scientific community has been recognizing the paramount role of the cell microenvironment in determining cell behavior. In parallel, the study of human stem cells for their potential therapeutic applications has been progressing constantly. The use of advanced technologies, enabling one to mimic the in vivo stem cell microenviroment and to study stem cell physiology and physio-pathology, in settings that better predict human cell biology, is becoming the object of much research effort. In this review we will detail the most relevant and recent advances in the field of biosensors and micro- and nano-technologies in general, highlighting advantages and disadvantages. Particular attention will be devoted to those applications employing stem cells as a sensing element.


Figures

Figure 1.
Figure 1.
Attributes of a cell-based assay. Left: throughput improvements in laboratory techniques with the dramatic miniaturization of cell assays. With cell microchips, the simultaneous screening of thousands of compounds and different cell responses can be achieved using very small volumes of expensive reagents and small numbers of rare cells. Right: a representation of the stem cell niche (stem cells microenvironment). A list of stimuli and effects (assay variables) involved in the maintenance of stem cell characteristics or in their differentiation are evidenced. Multisensors (e.g., FET with source (S) and drain (D) indicated, and MEA allowing the detection of metabolic and secreted compounds) allow the dynamic analysis of stimuli response in living cells.
Figure 2.
Figure 2.
Scheme of spotted-cell microarray spotting. I. Microarray spotter. II. Cell suspension is collected from a 384 well plate by a microarray head supplied with 48 pins. III. Printing on glass slide. IV. Types of printing pins: (1.) pin with a regular uptake channel; (2.) pin with a “bubble” uptake channel; (3.) pin with an “extended bubble” channel and (4.) pin with an enlarged channel suited for cell delivery. Liquid load are 0.25 and 0.60 μL for pin 1 and 2, whereas 1.25 μL are loaded on pin type 3 and 4. Scale bar equals 200 μm. Bottom: enlargement of a printed area in the microarray slide. In A4 are showed nine spots of solution optimized for printing cells with a type 4 pin. B4 shows an enlargement of a spot from A4. C4 shows a spot of printed cells (C2C12 cell line).
Figure 3.
Figure 3.
(A). The soft lithography method. PDMS (polydimethylsiloxane) stamps are formed by replica molding onto a negative photoresist mold, generated via UV-mediated (ultraviolet) selective crosslinking through a photomask containing the desired features of photosensitive resins. A PDMS stamp is used to transfer ECM onto the supporting materials, creating a specific pattern for cell adhesion. (B). Satellite cells cultured on patterned hydrogel. 5 h after seeding, mouse satellite cells are attached only in correspondence of the laminin lanes (I.) producing aligned pattern after 3 (II.) and 7 (III.) days in culture (scale bar = 100 μm). The inset in (III.) shows the occurred fusion into myotubes (arrow; scale bar=37.5 μm). Interference microscope image shows aligned satellite cells after 7 days in culture (IV.) (scale bar = 100 μm). Newly formed myotubes express desmin (V.) (scale bar = 100 μm), troponin I, and mhc (VI.) (scale bar = 75 μm and 25 μm respectively for troponin and mhc). Organization in regular and uniform striations of mhc is highlighted on the two insets (VI.). Cell nuclei were counterstained with Hoechst (blue). Modified from [96].
Figure 4.
Figure 4.
A. Schematic diagram of a construct consisting of multiple 3D matrices: a microfluidically patterned phase and a bulk microfluidic hydrogel phase. Magnified view of the interface (boxed region in (A)) showing the formation of each phase. (I) The bulk phase is formed by doping collagen into an alginate solution and allowing a collagen fibers network to form (by increasing temperature). (II) The alginate is gelled (by ionic crosslinking) around the collagen fiber network to complete formation of the bulk matrix. (III) A second collagen-doped ECM (for example, fibrinogen) solution is then patterned within the bulk phase. As temperature is increased, collagen precursors in the second ECM nucleate and assemble from exposed collagen fibers at the interface to integrate the two matrices. (IV) Formation of the patterned ECM is completed on gelling of fibrin in this example (by diffusion of a thrombin solution into the construct to cleave fibrinogen into fibrin in situ). (B). Time-lapse differential interference contrast imaging of collagen fibers assembly at the phase interface. Collagen fibers in the patterned ECM assemble from the collagen-doped bulk phase interface into the polymerizing ECM solution (left panel), but do not nucleate from a pure alginate bulk phase interface (right panel). Scale bar is 10 μm. (C). HUVECs (red) are localized to the channel pattern, whereas the fibroblasts (green) are distributed uniformly throughout a pure alginate bulk phase. Scale bar is 500 μm. (D) and (E). Confocal reflectance microscopy. In (D), the 3D reconstruction of microfluidically patterned collagen (green) seeded with HUVECs (red) in a bare alginate bulk phase confirms that HUVEC-seeded collagen completely filled the channels (as opposed to coating the walls) and that the phases were separated by the intended sharp boundaries. In (E), the 3D reconstruction of the confocal z series through a collagen–alginate bulk phase before microfluidic patterning of collagen. Modified from [116].
Figure 5.
Figure 5.
(A) Schematic diagram of MEA cell-based biosensor. In yellow the electrode and in blue the insulator. (B) SEM picture of 3D MEA recording area. It is composed of 60 tip-shaped protruding platinum electrodes. The height of the glass tips is about 60 μm. Modified from [132].
Figure 6.
Figure 6.
(A) Schematic diagram of EICS cell-based biosensor. Measuring the current and voltage across a small empty electrode, the impedance, can be calculated. When cells cover the electrode the measured impedance changes because the cell membranes block the current flow. (B) Time-course measurement of mean impedance at 64 kHz. Adipose derived stem cells (ADSCs) were seeded (t = 0) on multiwell preprinted electrodes arrays. At t = 93 h, ADSCs were induced toward osteoblasts (n = 3) and adipocytes (n = 3) with osteogenesis and adipogenesis differentiation medium, respectively. Non-induced ADSCs (n = 3) were kept growing after confluence until cell detachment occurred. Clear differences in impedance can be observed between all groups. Modified from [140].
Figure 7.
Figure 7.
(A) Cell/transistor hybrid. The open-gate area of the FET is completely covered by one cell as indicated in the schematics. S and D designate the built-in source and drain connections, while B the bulk. (B) Schematics of 3D device fabrication (I. and II.) The dimensions of the lightly doped n-type silicon segment (white dots) are ∼80 by 80 by 200 nm3. H and θ are the tip height and orientation, respectively. In III the SEM image of an as-made device. Scale bar 5 μm. Highlight of extracellular (IV.) and intracellular (V.) nanowire/cell interfaces. Modified from [144].
Figure 8.
Figure 8.
Schematic set-up of a LAPS device with living cells and light sources. Modified from [147].
Figure 9.
Figure 9.
(A) Schematic of microfluidic device. Scale bar: 4 mm. The device features 6 sample input channels, each divided into 50 compound reaction chambers for a total of 300 RT-qPCR reactions using approximately 20 μL of reagents. The rectangular box indicates the region depicted in B. (B) Optical micrograph of array unit. For visualization, the fluid paths and control channels have been loaded with blue and red dyes, respectively. Each unit consists of (i) a reagent injection line, (ii) a 0.6 nL cell capture chamber with integrated cell traps, (iii) a 10 nL reverse transcription (RT) chamber, and (iv) a 50 nL PCR chamber. Scale bar: 400 μm. (C) Optical micrograph of two cell capture chambers with trapped single cells indicated by black arrows. Each trap includes upstream deflectors to direct cells into the capture region. Scale bar: 400 μm. (D–I) Device operation. (D) A single-cell suspension is injected into the device. (E) Cell traps isolate single cells from the fluid stream and permit washing of cells to remove extracellular RNA. (F) Actuation of pneumatic valves results in single-cell isolation prior to heat lysis. (G) Injection of reagent (green) for RT reaction (10 nL). (H) Reagent injection line is flushed with subsequent reagent (blue) for PCR. (I) Reagent for qPCR (blue) is combined with RT product in 50 nL qPCR chamber. Scale bar for DI: 400 μm. (L and M) Histograms showing the distribution of the expression of each transcript (Oct4 and miRNA145) in 1,094 hESC single-cells. Dash line indicates the gene mean copy number. Modified from [178].

References

    1. ReportBuyer Available online: http://www.reportbuyer.com/computing_electronics/electrical_components/b... (accessed on 28 August 2012)
    1. Li X., Quigg R.J., Zhou J., Gu W., Nagesh Rao P., Reed E.F. Clinical utility of microarrays: current status, existing challenges and future outlook. Curr. Genomics. 2008;9:466–474. - PMC - PubMed
    1. Rogers S., Cambrosio A. Making a new technology work: the standardization and regulation of microarrays. Yale J. Biol. Med. 2007;80:165–178. - PMC - PubMed
    1. Konrad A., Jochmann R., Kuhn E., Naschberger E., Chudasama P., Sturzl M. Reverse transfected cell microarrays in infectious disease research. Methods Mol. Biol. 2011;706:107–118. - PubMed
    1. Fernandes T.G., Diogo M.M., Clark D.S., Dordick J.S., Cabral J.M. High-throughput cellular microarray platforms: applications in drug discovery, toxicology and stem cell research. Trends Biotechnol. 2009;27:342–349. - PMC - PubMed

Publication types