. 2013 Jan;14(1):90-9.
doi: 10.1038/ni.2490. Epub 2012 Dec 2.

Shared and distinct transcriptional programs underlie the hybrid nature of iNKT cells

Collaborators, Affiliations

Shared and distinct transcriptional programs underlie the hybrid nature of iNKT cells

Nadia R Cohen et al. Nat Immunol. 2013 Jan.

Abstract

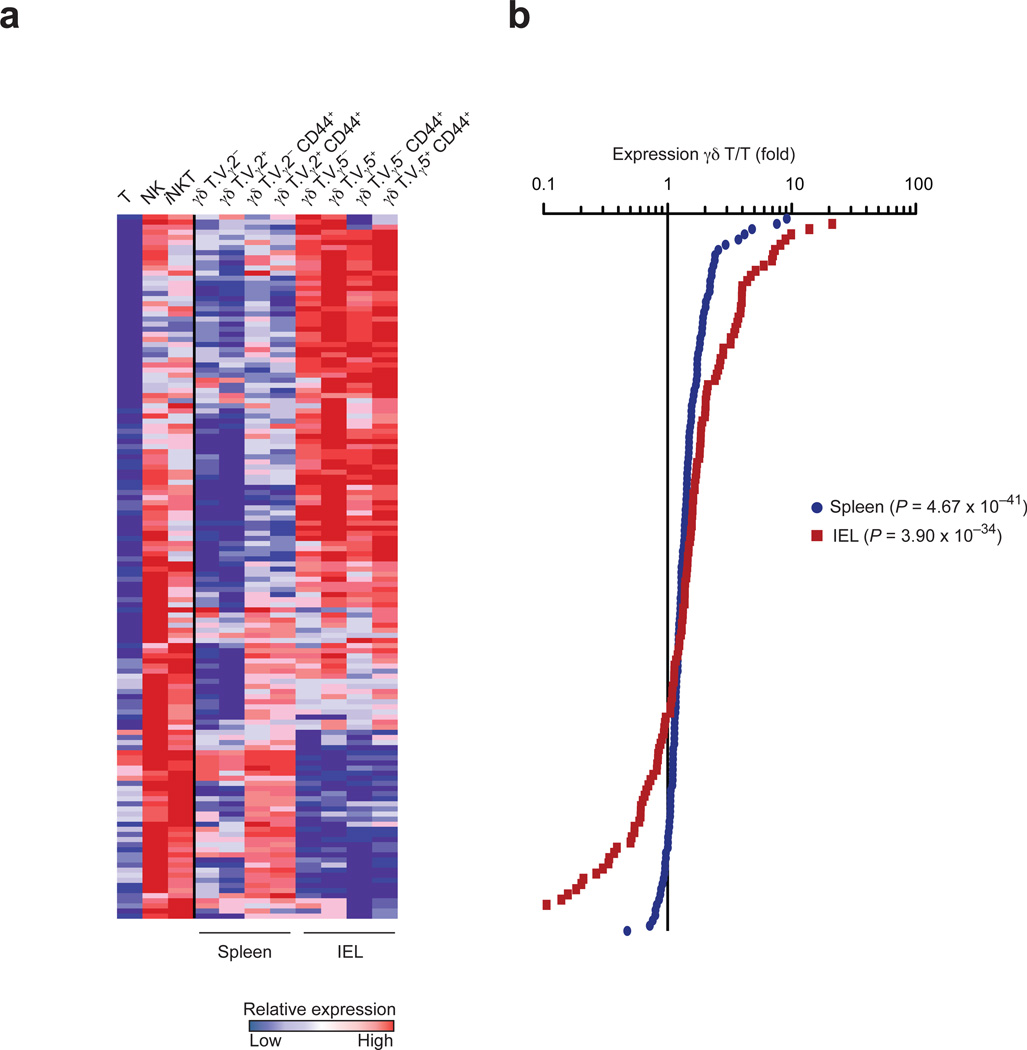
Invariant natural killer T cells (iNKT cells) are innate-like T lymphocytes that act as critical regulators of the immune response. To better characterize this population, we profiled gene expression in iNKT cells during ontogeny and in peripheral subsets as part of the Immunological Genome Project. High-resolution comparative transcriptional analyses defined developmental and subset-specific programs of gene expression by iNKT cells. In addition, we found that iNKT cells shared an extensive transcriptional program with NK cells, similar in magnitude to that shared with major histocompatibility complex (MHC)-restricted T cells. Notably, the program shared by NK cells and iNKT cells also operated constitutively in γδ T cells and in adaptive T cells after activation. Together our findings highlight a core effector program regulated distinctly in innate and adaptive lymphocytes.


Figures

Fig. 1
Fig. 1
iNKT cells upregulate NKRs at the end of thymic differentiation. (a) Flow cytometric identification of thymic iNKT cells. (b) Number of genes differentially expressed during iNKT cell developmental transitions. (c) Genes differentially expressed between DP thymocytes and stage 1 (top), stage 1 and stage 2 (middle), and stage 2 and stage 3 iNKT cells (bottom). Genes upregulated are highlighted in red or blue, respectively. See Supplementary Tables 1–6 for complete lists. (d) Genes differentially expressed in stage 1 iNKT cells versus DP thymocytes. Colored highlights indicate genes differentially regulated in iNKT but not in CD4+8int compared to DP thymocytes. See Supplementary Tables 7 and 8 for complete lists. For b-d, only genes with expression above the detection level one or more subsets and a coefficient of variation (CV) < 0.5 in all subsets were considered. The differential expression threshold used was FC > 2. (e) Expression of NKRs in differentiating thymocytes (see Supplementary Table 16 for key to subset nomenclature). Values were log2-transformed, row centered and locally color scaled. (f) NKR surface expression as determined by flow cytometry. Bars, mean percentage-positive ± s.e.m., n=3 mice. Data is representative of at least two independent experiments. (g) Expression of an NKR-containing gene cluster derived from a Euclidian distance-based K-means clustering analysis (mean correlation, 0.958). Genes were pre-filtered for expression and for FC > 2 between any 2 subsets, and data was log2-transformed. Klra3, 5, 6, 9, 10, Klrb1b, c, f, Klrc1, 2, 3, Klrd1, Klri2 and Klrk1 are labeled in red.
Fig. 2
Fig. 2
Expression of NKRs in peripheral CD4+ and CD4 iNKT cells. (a) Top, differential gene expression between CD4+ and CD4iNKT cells from the spleen; bottom, differential gene expression between CD4+ and CD4 iNKT cells from the liver. Genes up- or downregulated with FC > 2 in CD4 compared to CD4+ subsets are highlighted in red or blue, respectively. Only genes with expression values above the detection level in at least one subset and a CV < 0.5 in all subsets are displayed. (b) Flow cytometric quantification of NKRs on spleen and liver CD4+ and CD4 iNKT cells. Bars represent mean percentage-positive for surface expression ± s.e.m., n=3 mice. Data is representative of at least two independent experiments. (c) NKR expression in peripheral MHC-restricted T and iNKT cell subsets. Values were log2-transformed, gene row centered and local color scaling was used. See Supplementary Table 16 for key to subset nomenclature.
Fig. 3
Fig. 3
The global transcriptional relationship between NK and iNKT cells is similar in magnitude to the relationship between T and iNKT cells. Euclidian distance matrix calculated using the 15% most variable probes. Only genes with mean expression values above 120 were included in these analyses, and data was log2 transformed and mean centered. Numbers represent average Euclidian distances between intersecting subsets. Note that the matrix is symmetrical along the indicated diagonal. Areas of interest are marked with lowercase Roman numerals.
Fig. 4
Fig. 4
Characterization of shared and differential gene expression among iNKT, NK, and T cells. One-way ANOVA was performed to compare gene expression in iNKT, NK, and T cell populations. Differentially expressed genes were separated into six categories depending on common patterns in 2 of the 3 subsets. Genes up- (A1) or down- (A2) regulated in NK and iNKT compared to T cells; genes up- (B1) or down- (B2) regulated in iNKT and T compared to NK cells; genes up- (C1) or down- (C2) regulated in iNKT compared to T or NK cells. (a) Left, heatmap of genes expressed differentially in iNKT, NK, and T cells for the indicated cell subsets, separated according to category; right, proportion of differentially expressed genes in each category. (b-d) Expression of ANOVA category genes in relevant manually selected functional gene groups (see methods). Genes reported in the literature to be highly expressed in each category shown in underlined bold. In all heatmaps, rows are mean-centered and normalized, and local scaling is used. See Supplementary Table 16 for key to subset nomenclature.
Fig. 5
Fig. 5
Transcriptional programs shared between NK and iNKT cells are acquired during thymic iNKT cell maturation. (a) Top, relative expression of genes significantly upregulated in peripheral NK and iNKT cells (ANOVA category A1) over the course of thymic T and iNKT cell maturation. Genes were ordered by hierarchical clustering using Pearson correlation. Rows are mean-centered and normalized, and local scaling is used. Bottom, percentages of genes exceeding the threshold for expression over the course of thymic maturation. T cell populations are represented in the same order as in the heatmaps. (b) FC distribution of category A1 genes in stage 1, 2 and 3 iNKT cells compared to DP thymocytes with individual genes displayed in rank-order along the y-axis. P values represent significance of K-S test comparing the FC distribution of the ANOVA category A1 geneset to that of all expressed genes. See Supplementary Table 16 for key to subset nomenclature.
Fig. 6
Fig. 6
Activated splenic γδ T cells and IEL γδ T cells express NK- iNKT shared gene programs. (a) Relative expression of genes significantly upregulated in peripheral NK and iNKT compared to T cells (ANOVA category A1) in the splenic and IEL γδ T cell subsets indicated. Averaged values for the ANOVA subsets (iNKT, NKT and T) are displayed for comparison. Genes are ordered by hierarchical clustering using Pearson correlation. Rows are mean-centered, normalized and local color scaling is used. (b) ANOVA category A1 gene FC distributions for averaged splenic and IEL γδ T cell subsets compared to the averaged T cell subset displayed with individual genes displayed in rank-order along the y-axis. P values represent significance of K-S test comparing the distribution of the ANOVA category A1 geneset to that of all expressed genes. See Supplementary Table 16 for key to subset nomenclature.
Fig. 7
Fig. 7
NK-iNKT shared gene programs are induced in activated CD8+ T cells. (a) Relative expression of genes significantly upregulated in peripheral NK and iNKT cells (ANOVA category A1) in antigen-specific CD8+ T cells over the course of Listeria-OVA infection. See Supplementary Table 16 for key to subset nomenclature. (b) ANOVA category A1 gene FC distributions for activated CD8+ T cells compared to the naive control with individual genes displayed in rank-order along the y-axis. (c) Relative expression of the human gene homologs from ANOVA category A1 in human peripheral blood CD8+ T cell subsets from different donors. (d) FC distributions for human memory CD8+ T cells compared to the naive control, using human homologs of the ANOVA category A1 geneset. For all heatmaps, genes were ordered by hierarchical clustering using Pearson correlation. Rows are mean-centered and normalized, and relative scaling is used. For FC distribution plots, P values represent significance of K-S test comparing the distribution of the ANOVA category A1 geneset to that of all expressed genes. Nve., naïve; Ctr. Mem., central memory; Eff. Mem., effector memory.

Similar articles

Cited by

References

    1. Heng TS, Painter MW, Immunological Genome Project C. The Immunological Genome Project: networks of gene expression in immune cells. Nat Immunol. 2008;9:1091–1094. - PubMed
    1. Cohen NR, Garg S, Brenner MB. Antigen Presentation by CD1 Lipids, T Cells, and NKT Cells in Microbial Immunity. Adv Immunol. 2009;102:1–94. - PubMed
    1. Bendelac A, Savage PB, Teyton L. The biology of NKT cells. Annu Rev Immunol. 2007;25:297–336. - PubMed
    1. Godfrey DI, Stankovic S, Baxter AG. Raising the NKT cell family. Nat Immunol. 2010;11:197–206. - PubMed
    1. Coquet JM, et al. Diverse cytokine production by NKT cell subsets and identification of an IL-17-producing CD4-NK1.1- NKT cell population. Proc Natl Acad Sci U S A. 2008;105:11287–11292. - PMC - PubMed

Publication types