. 2013 Jan;14(1):72-81.
doi: 10.1038/ni.2479. Epub 2012 Dec 2.

The psoriasis-associated D10N variant of the adaptor Act1 with impaired regulation by the molecular chaperone hsp90

Affiliations

The psoriasis-associated D10N variant of the adaptor Act1 with impaired regulation by the molecular chaperone hsp90

Chenhui Wang et al. Nat Immunol. 2013 Jan.

Abstract

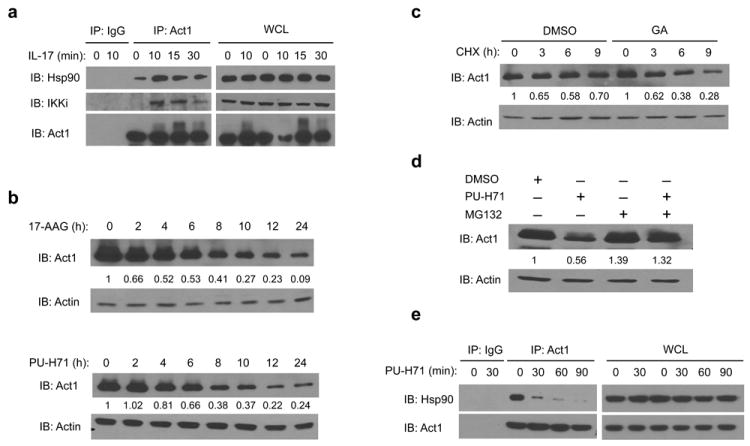
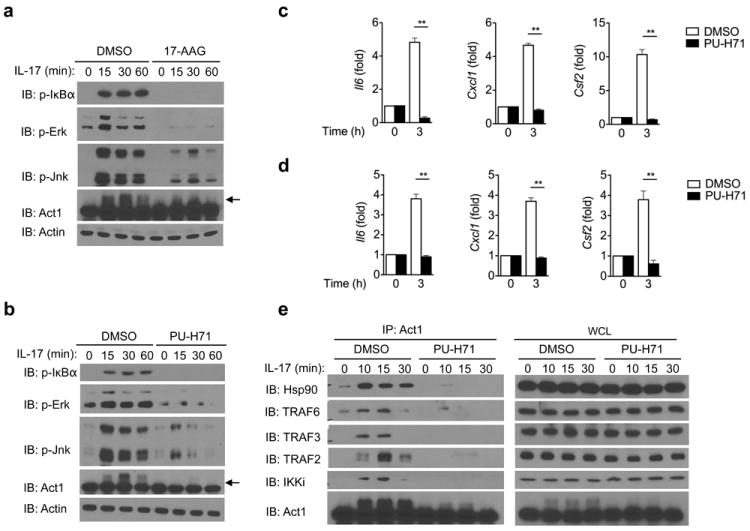
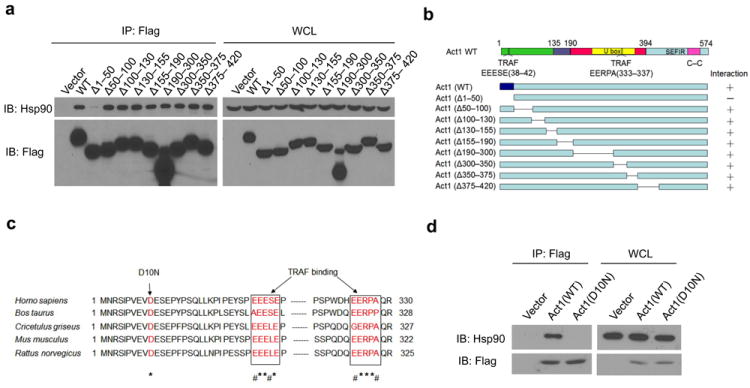
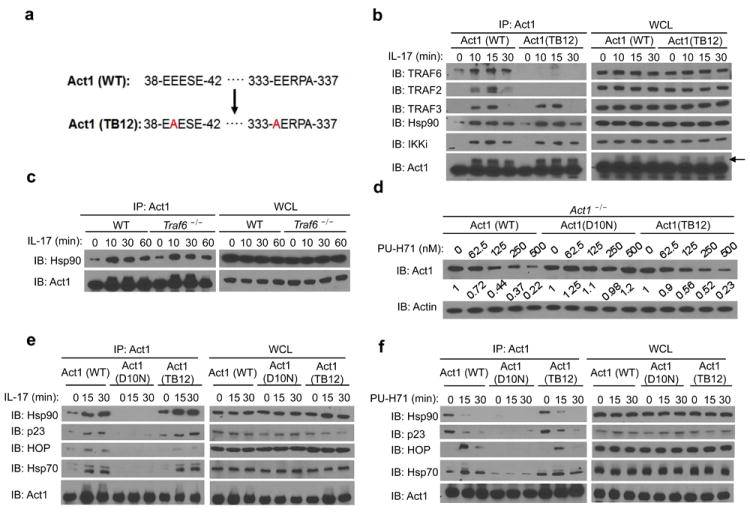
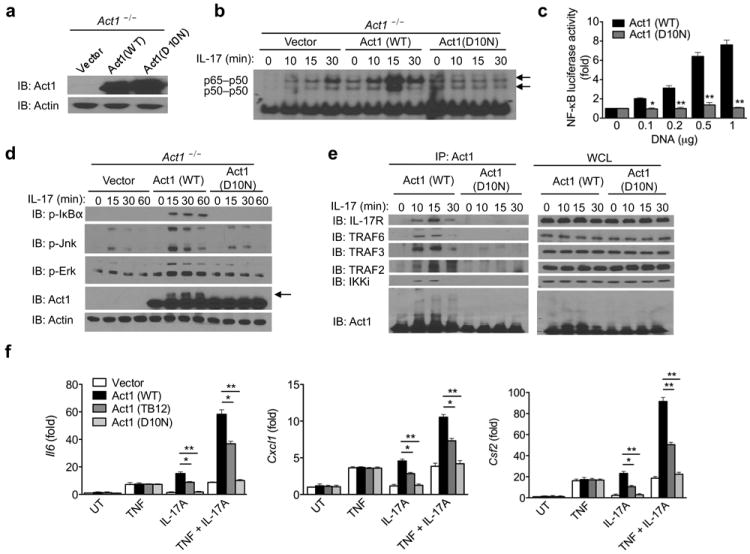
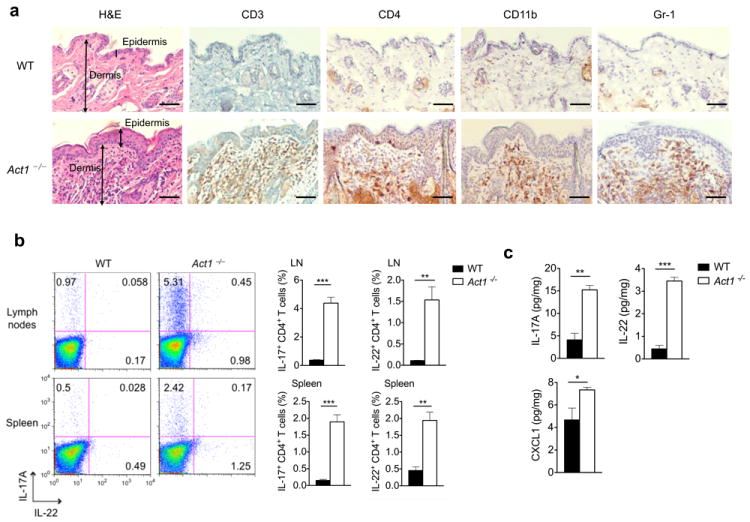
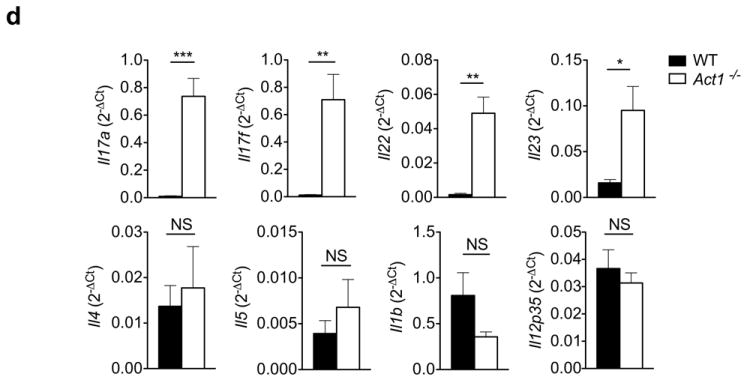
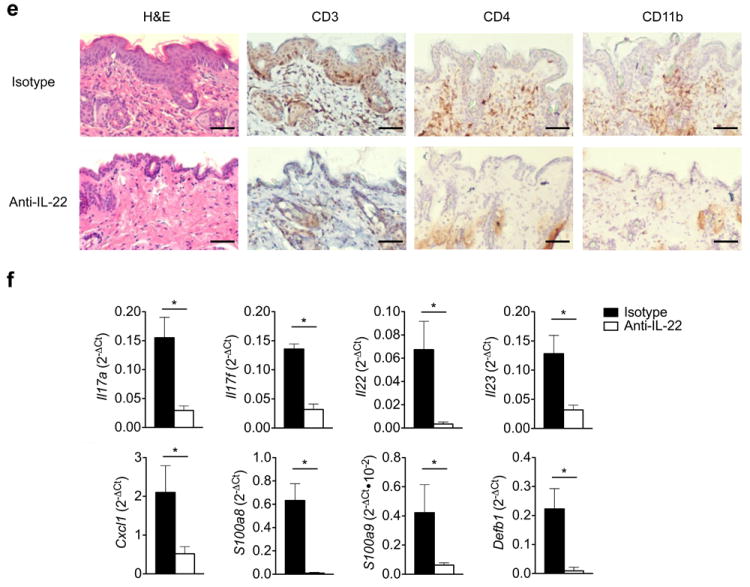
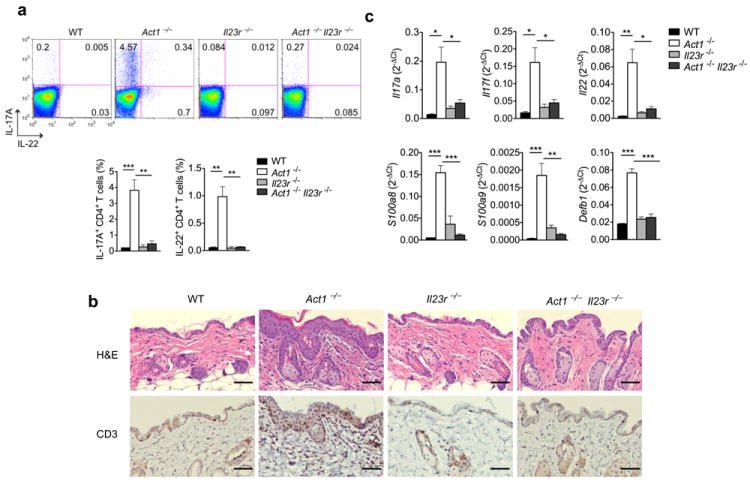
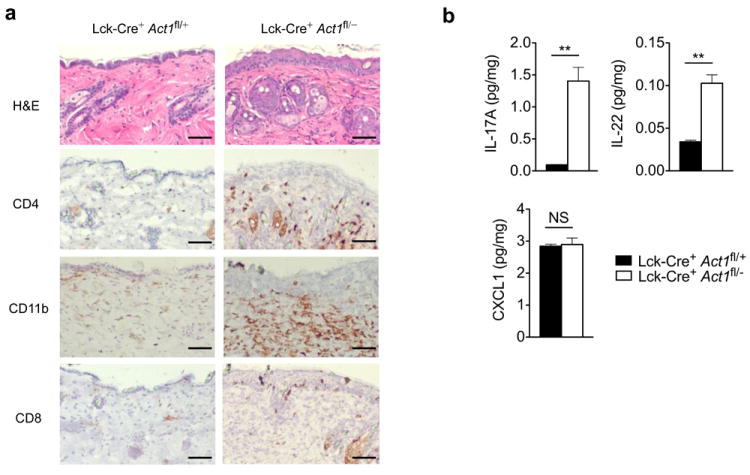
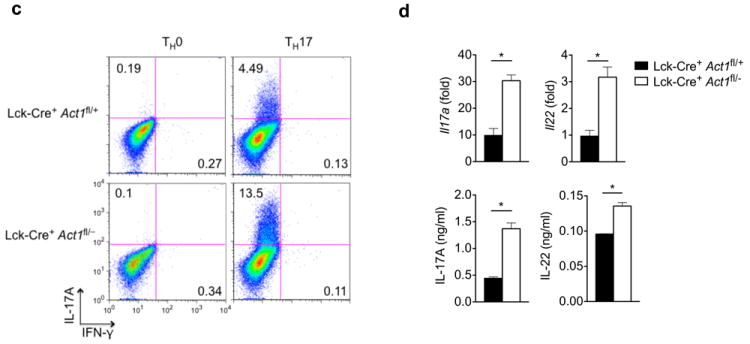
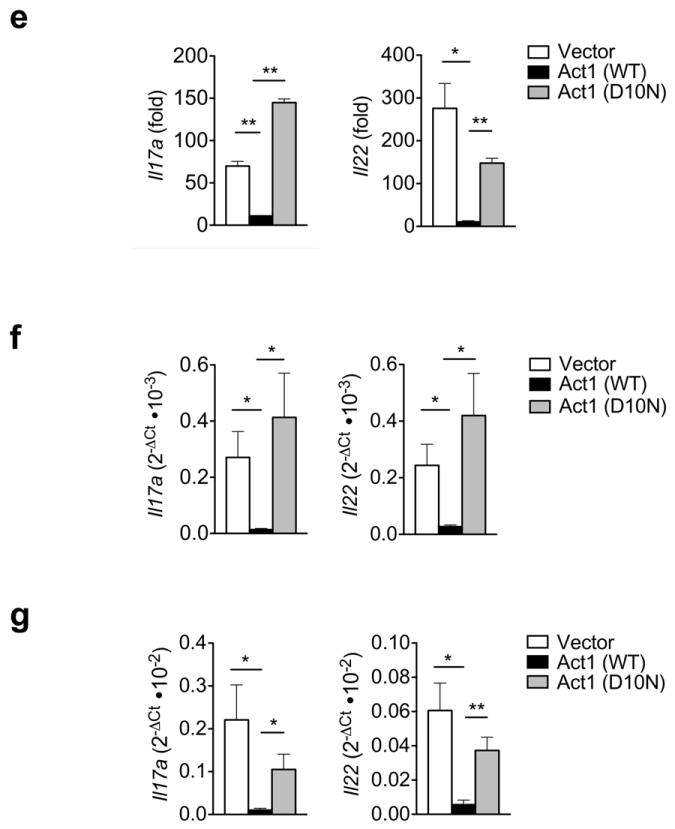
Act1 is an essential adaptor in interleukin 17 (IL-17)-mediated signaling and is recruited to the receptor for IL-17 after stimulation with IL-17. Here we found that Act1 was a 'client' protein of the molecular chaperone hsp90. The D10N variant of Act1 (Act1(D10N)) that is linked to susceptibility to psoriasis was defective in its interaction with hsp90, which resulted in a global loss of Act1 function. Act1-deficient mice modeled the mechanistic link between loss of Act1 function and susceptibility to psoriasis. Although Act1 was necessary for IL-17-mediated inflammation, Act1-deficient mice had a hyperactive response of the T(H)17 subset of helper T cells and developed spontaneous IL-22-dependent skin inflammation. In the absence of IL-17 signaling, IL-22 was the main contributor to skin inflammation, which provides a molecular mechanism for the association of Act1(D10N) with psoriasis susceptibility.


Figures

Figure 1
Figure 1. Act1 is a client protein of HSP90
(a) Lysates from MEFs treated with IL-17 (50ng/ml) for the indicated times were immunoprecipitated with anti-Act1 or IgG control, followed by immunoblot analysis for Hsp90, IKKi and Act1. Immunoprecipitated (IP) products are shown on left, whole cell lysates (WCL) are shown on right. (b) MEFs were treated with Hsp90 inhibitors 17-AAG (1μM) or PU-H71 (1μM) for the indicated times. Actin is used as loading control. The relative amount of total Act1 to actin was quantified by densitometry. The Act1 to actin ratio in untreated MEFs was defined as 1. (c) DMSO (control) or GA pretreated MEFs were incubated with 10 μg/ml cycloheximide (CHX) for the indicated times. The relative amount of total Act1 to actin was quantified by densitometry. The Act1 to actin ratio prior to CHX treatment was defined as 1. (d) MEFs were treated with DMSO, PU-H71 (0.5μM) alone, MG-132 (1μM) alone, or PU-H71 (0.5μM) plus MG-132 (1μM) for 12 hours. The relative amount of total Act1 to actin was quantified by densitometry. The Act1 to actin ratio in DMSO-treated MEFs was defined as 1. (e) Lysates from MEFs treated with PU-H71 (1μM) for the indicated times were immunoprecipitated with anti-Act1 or IgG control. The data are representative of three independent experiments.
Figure 2
Figure 2. Hsp90 activity is required for IL-17-induced Act1-mediated signaling
MEFs pretreated with 17-AAG (a) or PU-H71 (b) for 1 hour were stimulated with IL-17 (50ng/ml) for the indicated times, followed by immunoblot analysis for phosphorylated (p-) IκBα, p-Erk, p-Jnk, and Act1. Arrow indicates Act1 modification. (c) MEFs pretreated with PU-H71 for 1 hour were stimulated with IL-17 (50ng/ml) for the indicated times, followed by quantitative RT-PCR analysis for Il6, Cxcl1 and Csf2 expression. Results are presented as fold induction relative to time 0. (d) MEFs pretreated with PU-H71 for 1 hour were stimulated with IL-17F (50ng/ml) for the indicated times, followed by RT-PCR analysis of Il6, Cxcl1 and Csf2 expression. Results are presented as fold induction relative to time 0. (e) MEFs pretreated with PU-H71 for 1 hour were stimulated with IL-17 (50ng/ml) for the indicated times. Lysates were then immunoprecipitated with anti-Act1, followed by immunoblot analysis for Hsp90, TRAF6, TRAF3, TRAF2, IKKi and Act1. Immunoprecipitated (IP) products are shown on left, whole cell lysates (WCL) are shown on right. *p < 0.05, **p < 0.01 (Student’s t-test). The data are representative of three independent experiments.
Figure 3
Figure 3. Loss of interaction of psoriasis-associated variant, Act1 (D10N), with Hsp90
(a) HEK293 cells were transiently transfected with vector, Flag-tagged human wild-type (WT) Act1, or Flag-tagged deletion mutants of human Act1: Act1Δ1-50, Act1Δ50-100, Act1Δ100-130, Act1Δ130-155, Act1Δ155-190, Act1Δ190-300, Act1Δ300-350, Act1Δ350-375, or Act1Δ375-420. Lysates were immunoprecipitated with anti-Flag, followed by immunoblot analysis for Hsp90 and Flag. (b) Schematics of Act1-deletion mutants. Right column indicates interaction with Hsp90. (c) Alignment of Act1 sequences from Homo sapiens (human), Bos taurus (cow), Cricetulus griseus (bacteria), Mus musculus (mouse), and Rattus norvegious (rat). Asterisks (*) denote identical amino acids and the number sign (#) denotes conserved substitutions. (d) HEK293 cells were transfected with vector, Flag-tagged human Act1 (WT) and Act1 (D10N). Cell lysates were immunoprecipitated with anti-Flag, followed by immunoblot analysis for Hsp90 and Flag. Immunoprecipitated (IP) products are shown on left, whole cell lysates (WCL) are shown on right. The data are representative of three independent experiments (a, d).
Figure 4
Figure 4. IL-17-induced Act1-Hsp90 interaction is TRAF6 independent
(a) Schematics of TRAF-binding site mutant (TB12) of Act1. (b) Act1-/- MEFs transduced with Act1 (WT) or Act1 (TB12) were treated with IL-17 (50ng/ml) for the indicated times. Cell lysates were immunoprecipitated with anti-Act1, followed by immunoblot analysis for TRAF6, TRAF2, TRAF3, Hsp90, IKKi and Act1. (c) Lysates from WT or Traf6-/- MEFs treated with IL-17 (50ng/ml) for the indicated times were immunoprecipitated with anti-Act1, followed by immunoblot analysis for Hsp90 and Act1. (d) Act1-/- MEFs transduced with Act1 (WT), Act1 (D10N), or Act1 (TB12) were left untreated (0) or treated with varying concentrations of PU-H71 for 24 hours. The relative amount of total Act1 to actin was quantified by densitometry. The Act1 to actin ratio in untreated MEFs was defined as 1. (e) Act1-/- MEFs transduced as in (d) were treated for the indicated times with IL-17 (50ng/ml). Cell lysates were immunoprecipitated with anti-Act1, followed by immunoblot analysis for Hsp90, p23, HOP, Hsp70 and Act1. (f) Act1-/- MEFs transduced as in (d) were treated for the indicated times with PU-H71 (1μM). Cell lysates were immunoprecipitated with anti-Act1, followed by immunoblot analysis for Hsp90, p23, HOP, Hsp70 and Act1. Immunoprecipitated (IP) products are shown on left, whole cell lysates (WCL) are shown on right. Data are representative of three independent experiments.
Figure 5
Figure 5. Act1 (D10N) is a loss of function variant
(a) Act1-/- MEFs transduced with vector, Act1 (WT), or Act1 (D10N) were subjected to immunoblot analysis for Act1 expression. (b) Act1-/- MEFs transduced as in (a) were treated with IL-17 (50ng/ml) for the indicated times. Cell lysates were subjected to gel-shift assay for NF-κB activation. (c) HEK293 cells transfected with E-selectin–luciferase reporter (100ng) and the indicated amounts of human Act1 or human Act1 (D10N) DNA, followed by luciferase assay analysis of NF-κB activity. (d) Act1-/- MEFs transduced as in (a) were treated with IL-17 (50ng/ml) for the indicated times, followed by immunoblot analysis. Arrow indicates Act1-modification. (e) Act1-/- MEFs transduced as in (a) were treated with IL-17 (50ng/ml) for the indicated times. Cell lysates were immunoprecipitated with anti-Act1, followed by immunoblot analysis for IL-17R, TRAF6, TRAF3, TRAF2, IKKi and Act1. Immunoprecipitated (IP) products are shown on left, whole cell lysates (WCL) are shown on right. (f) Act1-/- MEFs transduced with vector, Act1 (WT), Act1 (TB12), or Act1 (D10N) were left untreated or treated for 3 hours with TNF (10ng/ml), IL-17A (50ng/ml), IL-17F (50ng/ml), or TNF in combination with IL-17A, followed by RT-PCR analysis for Il6, Cxcl1 and Csf2 expression. The data are shown as fold induction over untreated (UT). *p < 0.05, **p < 0.01 and ***p < 0.005 (Student’s t-test). Data are representative of three independent experiments.
Figure 6
Figure 6. IL-22 neutralization attenuates skin inflammation in Act1-/- mice
(a) Skin sections from 6 weeks old Act1 (WT) or Act1-/- mice were stained with hematoxylin and eosin (H&E) or with antibodies against cell surface markers for T cells (CD3, CD4), macrophages (CD11b), or neutrophils (Gr-1). CD3+, CD11b+, Gr-1+ and CD4+ cells are stained brown. Scale bar indicates 50μm. (b) Cells isolated from the spleen and lymph nodes (cervical, axillary, and inguinal) of 6 weeks old WT or Act1-/- mice were stimulated with PMA (20ng/ml) plus ionomycin (500ng/ml) for 5 hours followed by intracellular staining for IL-17A and IL-22. Flow plots are gated on CD4+ T cells. Right graphs indicate the percentage of IL-17+ and IL-22+ CD4+ T cells in the spleen and lymph nodes. (c) Cytokine production from skin infiltrates detected by ELISA. Skin infiltrates were isolated from the skin as described and cultured with anti-CD3/anti-CD28 for 12 hours. Cytokine production was normalized to skin tissue weight. (d) RT-PCR analysis of cytokine transcripts in the skin of 6 weeks old WT or Act1-/- mice. Data are graphed as mean 2-ΔCt ± SEM, where ΔCt=Cttarget – Ctactin. (e) Act1-/- mice were treated with 500μg of anti-IL-22 (I.P. injection) every other day for 3 weeks starting at 21 days of age. Skin sections from anti-IL-22 or isotype-treated mice were stained with hematoxylin and eosin or with anti-CD3, anti-CD4, or anti-CD11b. Scale bar indicates 50μm. (f) RT-PCR analysis of cytokine transcripts in the skin of anti-IL-22 or isotype treated mice. Data are graphed as mean 2-ΔCt ± SEM. *p < 0.05, **p < 0.01, ***p < 0.005, NS (not significant) (Student’s t-test). Data are representative of three independent experiments with 3-5 mice per group per experiment.
Figure 7
Figure 7. Skin inflammation is attenuated in Act1-/- Il23r-/-mice
(a) Cells isolated from the lymph nodes of 6 weeks old WT, Act1-/-, Il23r-/-, or Act1-/- Il23r-/- mice were stimulated with PMA (20ng/ml) plus ionomycin (500ng/ml) for 5 hours followed by intracellular staining for IL-17A and IL-22. Right graph indicates the percentage of IL-17+ and IL-22+ CD4+ T cells in the lymph nodes. Flow plots are gated on CD4+ T cells. (b) Skin sections from 6 weeks old WT, Act1-/-, Il23r-/-, or Act1-/- Il23r-/- mice were stained with hematoxylin and eosin or with anti-CD3. Scale bar indicates 50μm. (c) RT-PCR analysis of cytokine transcripts in the skin of 6 weeks old WT, Act1-/-, Il23r-/-, or Act1-/- Il23r-/- mice. Data are graphed as mean 2-ΔCt ± SEM. *p < 0.05, **p < 0.01 (Student’s t-test). Data are representative of two independent experiments with 4 mice per group per experiment.
Figure 8
Figure 8. Skin inflammation is observed in T cell-specific Act1-/- mice
(a) Skin sections from Lck-Cre+ Act1fl/+ and Lck-Cre+ Act1fl/- mice were stained with H&E or antibodies against cell surface markers. CD4+, CD11b+ and CD8+ cells are stained brown. Scale bar indicates 50μm. (b) Cytokine production by skin infiltrates from Lck-Cre+ Act1fl/+ and Lck-Cre+ Act1fl/- mice. Cytokine production was normalized to tissue weight. (c) Naïve T cells were isolated from Lck-Cre+ Act1fl/- or Lck-Cre+ Act1fl/- mice and cultured on plate-bound anti-CD3/anti-CD28 under TH0 or TH17 skewing conditions. Following 3 days of culture, cells were restimulated with PMA (20ng/ml) and ionomycin (500ng/ml) for 5 hours followed by intracellular staining for IL-17A. (d) Ex vivo polarized TH17 cells were subjected to RT-PCR analysis for Il17a and Il22 expression after 3 days of culture (top). Culture supernatants were subjected to ELISA for IL-17A and IL-22 production (bottom). (e) Act1-/- T cells were transduced with retrovirus carrying vector, WT, or Act1 (D10N) and polarized to TH17 cells with anti-CD3/anti-CD28 in the presence of TGF-β and IL-6. GFP+ cells were sorted for RT-PCR analysis for Il17a and Il22 expression. The data are shown as fold induction of polarized TH17 cells over non-polarized T cells. (f-g) Act1-/- T cells were transduced with retrovirus carrying vector, WT, or Act1 (D10N). GFP+ cells were sorted and injected intravenously into RAG1-/- mice at 5×10⁶ cells per mouse. Two weeks post adoptive transfer, lymph nodes (f) and spleen (g) were isolated from RAG1-/- mice, followed by RT-PCR analysis for Il17a and Il22 expression. *p < 0.05, **p < 0.01, ***p < 0.005, NS (not significant) (Student’s t-test). Data are representative of three (a-c) or two (d-g) independent experiments.

Comment in

Similar articles

Cited by

References

    1. Lowes MA, Bowcock AM, Krueger JG. Pathogenesis and therapy of psoriasis. Nature. 2007;445:866–873. - PubMed
    1. Nickoloff BJ, Nestle FO. Recent insights into the immunopathogenesis of psoriasis provide new therapeutic opportunities. J Clin Invest. 2004;113:1664–1675. - PMC - PubMed
    1. Chan JR, et al. IL-23 stimulates epidermal hyperplasia via TNF and IL-20R2-dependent mechanisms with implications for psoriasis pathogenesis. J Exp Med. 2006;203:2577–2587. - PMC - PubMed
    1. Bettelli E, et al. Reciprocal developmental pathways for the generation of pathogenic effector TH17 and regulatory T cells. Nature. 2006;441:235–238. - PubMed
    1. Harrington LE, et al. Interleukin 17-producing CD4+ effector T cells develop via a lineage distinct from the T helper type 1 and 2 lineages. Nat Immunol. 2005;6:1123–1132. - PubMed

Publication types

MeSH terms