Comparative antitumor effect of preventive versus therapeutic vaccines employing B16 melanoma cells genetically modified to express GM-CSF and B7.2 in a murine model
- PMID: 23202306
- PMCID: PMC3509698
- DOI: 10.3390/toxins4111058
Comparative antitumor effect of preventive versus therapeutic vaccines employing B16 melanoma cells genetically modified to express GM-CSF and B7.2 in a murine model
Abstract
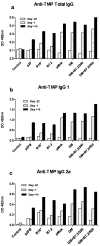
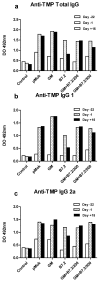
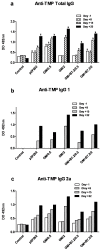
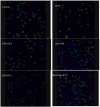
Cancer vaccines have always been a subject of gene therapy research. One of the most successful approaches has been working with genetically modified tumor cells. In this study, we describe our approach to achieving an immune response against a murine melanoma model, employing B16 tumor cells expressing GM-CSF and B7.2. Wild B16 cells were injected in C57BL6 mice to cause the tumor. Irradiated B16 cells transfected with GM-CSF, B7.2, or both, were processed as a preventive and therapeutic vaccination. Tumor volumes were measured and survival curves were obtained. Blood samples were taken from mice, and IgGs of each treatment group were also measured. The regulatory T cells (Treg) of selected groups were quantified using counts of images taken by confocal microscopy.
Results: one hundred percent survival was achieved by preventive vaccination with the group of cells transfected with p2F_GM-CSF. Therapeutic vaccination achieved initial inhibition of tumor growth but did not secure overall survival of the animals. Classical Treg cells did not vary among the different groups in this therapeutic vaccination model.
Figures


Similar articles
-
Comparative antitumor effect among GM-CSF, IL-12 and GM-CSF+IL-12 genetically modified tumor cell vaccines.Cancer Gene Ther. 2013 Oct;20(10):576-81. doi: 10.1038/cgt.2013.54. Epub 2013 Aug 23. Cancer Gene Ther. 2013. PMID: 23969885
-
Therapy of established tumour with a hybrid cellular vaccine generated by using granulocyte-macrophage colony-stimulating factor genetically modified dendritic cells.Immunology. 1999 Aug;97(4):616-25. doi: 10.1046/j.1365-2567.1999.00823.x. Immunology. 1999. PMID: 10457215 Free PMC article.
-
Antigens and cytokine genes in antitumor vaccines: the importance of the temporal delivery sequence in antitumor signals.Ann N Y Acad Sci. 2006 Dec;1091:412-24. doi: 10.1196/annals.1378.084. Ann N Y Acad Sci. 2006. PMID: 17341632
-
Gene therapy with B7.1 and GM-CSF vaccines in a murine AML model.J Pediatr Hematol Oncol. 1997 Nov-Dec;19(6):536-40. doi: 10.1097/00043426-199711000-00012. J Pediatr Hematol Oncol. 1997. PMID: 9407942 Review.
-
Pulsing of dendritic cells with cell lysates from either B16 melanoma or MCA-106 fibrosarcoma yields equally effective vaccines against B16 tumors in mice.J Surg Oncol. 1998 Jun;68(2):79-91. doi: 10.1002/(sici)1096-9098(199806)68:2<79::aid-jso3>3.0.co;2-h. J Surg Oncol. 1998. PMID: 9624036 Review.
Cited by
-
Antitumor cell-complex vaccines employing genetically modified tumor cells and fibroblasts.Toxins (Basel). 2014 Feb 19;6(2):636-49. doi: 10.3390/toxins6020636. Toxins (Basel). 2014. PMID: 24556729 Free PMC article.
-
Silencing of Foxp3 enhances the antitumor efficacy of GM-CSF genetically modified tumor cell vaccine against B16 melanoma.Onco Targets Ther. 2017 Jan 23;10:503-514. doi: 10.2147/OTT.S104393. eCollection 2017. Onco Targets Ther. 2017. PMID: 28176947 Free PMC article.
-
Fusion of the dendritic cell-targeting chemokine MIP3α to melanoma antigen Gp100 in a therapeutic DNA vaccine significantly enhances immunogenicity and survival in a mouse melanoma model.J Immunother Cancer. 2016 Dec 20;4:96. doi: 10.1186/s40425-016-0189-y. eCollection 2016. J Immunother Cancer. 2016. PMID: 28018602 Free PMC article.
-
Anti-IL-10-mediated Enhancement of Antitumor Efficacy of a Dendritic Cell-targeting MIP3α-gp100 Vaccine in the B16F10 Mouse Melanoma Model Is Dependent on Type I Interferons.J Immunother. 2018 May;41(4):181-189. doi: 10.1097/CJI.0000000000000212. J Immunother. 2018. PMID: 29334492 Free PMC article.
-
Vitamin D receptor and CD86 expression in the skin of vitamin D-deficient swine.Exp Mol Pathol. 2014 Feb;96(1):42-7. doi: 10.1016/j.yexmp.2013.11.002. Epub 2013 Nov 13. Exp Mol Pathol. 2014. PMID: 24239751 Free PMC article.
References
-
- Kim S., Carew J.F., Kooby D.A., Shields J., Entwisle C., Patel S., Shah J.P., Fong Y. Combination gene therapy using multiple immunomodulatory genes transferred by a defective infectious single-cycle herpes virus in squamous cell cancer. Cancer Gene Ther. 2000;7:1279–1285. - PubMed
-
- Veelken H., Mackensen A., Lahn M., Kohler G., Becker D., Franke B., Brennscheidt U., Kulmburg P., Rosenthal F.M., Keller H., et al. A phase-I clinical study of autologous tumor cells plus interleukin-2-gene-transfected allogeneic fibroblasts as a vaccine in patients with cancer. Int. J. Cancer. 1997;70:269–277. doi: 10.1002/(SICI)1097-0215(19970127)70:3<269::AID-IJC4>3.0.CO;2-V. - DOI - PubMed
-
- Palmer K., Moore J., Everard M., Harris J.D., Rodgers S., Rees R.C., Murray A.K., Mascari R., Kirkwood J., Riches P.G., et al. Gene therapy with autologous, interleukin 2-secreting tumor cells in patients with malignant melanoma. Hum. Gene Ther. 1999;10:1261–1268. doi: 10.1089/10430349950017941. - DOI - PubMed
-
- Wittig B., Marten A., Dorbic T., Weineck S., Min H., Niemitz S., Trojaneck B., Flieger D., Kruopis S., Albers A., et al. Therapeutic vaccination against metastatic carcinoma by expression-modulated and immunomodified autologous tumor cells: A first clinical phase I/II trial. Hum. Gene Ther. 2001;12:267–278. doi: 10.1089/10430340150218404. - DOI - PubMed
-
- Moller P., Sun Y., Dorbic T., Alijagic S., Makki A., Jurgovsky K., Schroff M., Henz B.M., Wittig B., Schadendorf D. Vaccination with IL-7 gene-modified autologous melanoma cells can enhance the anti-melanoma lytic activity in peripheral blood of patients with a good clinical performance status: A clinical phase I study. Br. J. Cancer. 1998;77:1907–1916. doi: 10.1038/bjc.1998.317. - DOI - PMC - PubMed
Publication types
MeSH terms
Substances
LinkOut - more resources
Full Text Sources
Medical

