Clinical Trial
. 2013 Jan 14:78:172-87.
doi: 10.1016/j.jprot.2012.11.013. Epub 2012 Nov 30.

Protein expression profiles of human lymph and plasma mapped by 2D-DIGE and 1D SDS-PAGE coupled with nanoLC-ESI-MS/MS bottom-up proteomics

Affiliations
Clinical Trial

Protein expression profiles of human lymph and plasma mapped by 2D-DIGE and 1D SDS-PAGE coupled with nanoLC-ESI-MS/MS bottom-up proteomics

Cristina C Clement et al. J Proteomics. .

Abstract

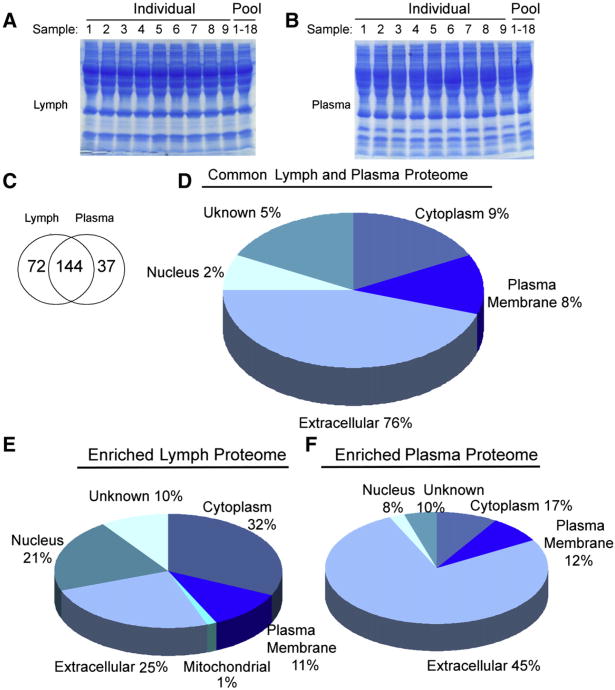
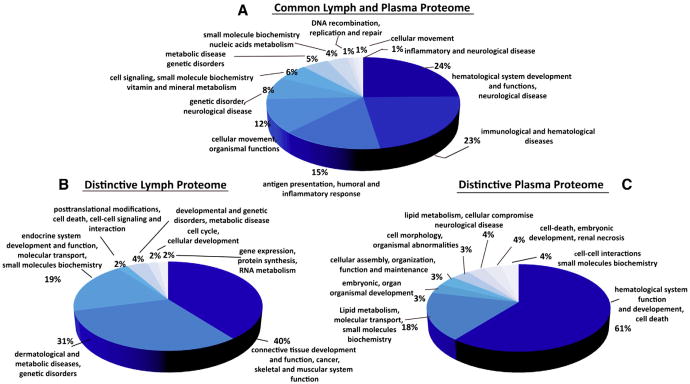
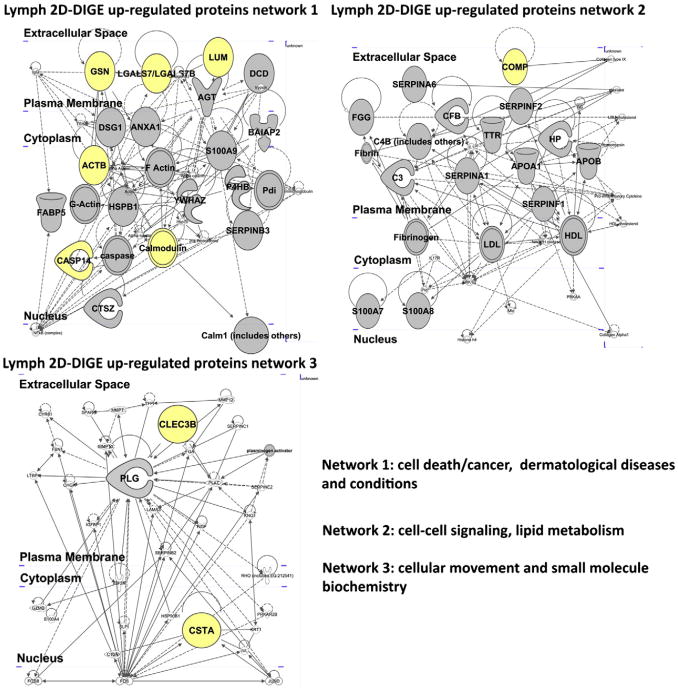
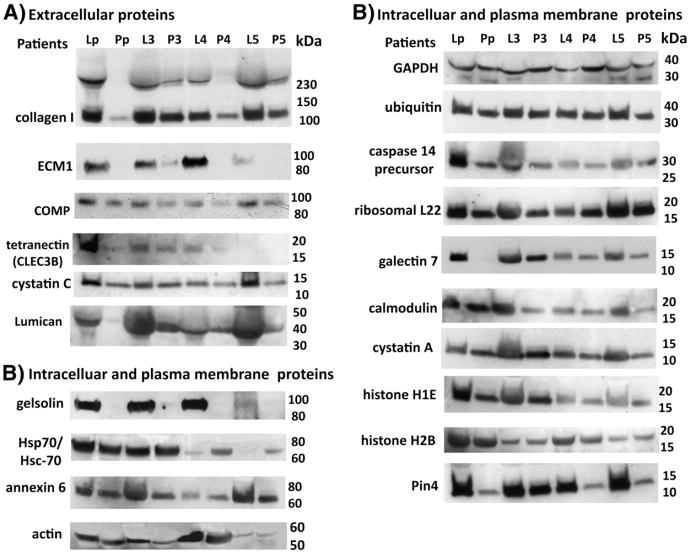
In this study a proteomic approach was used to define the protein content of matched samples of afferent prenodal lymph and plasma derived from healthy volunteers. The analysis was performed using two analytical methodologies coupled with nanoliquid chromatography-tandem mass spectrometry: one-dimensional gel electrophoresis (1DEF nanoLC Orbitrap-ESI-MS/MS), and two-dimensional fluorescence difference-in-gel electrophoresis (2D-DIGE nanoLC-ESI-MS/MS). The 253 significantly identified proteins (p<0.05), obtained from the tandem mass spectrometry data, were further analyzed with pathway analysis (IPA) to define the functional signature of prenodal lymph and matched plasma. The 1DEF coupled with nanoLC-MS-MS revealed that the common proteome between the two biological fluids (144 out of 253 proteins) was dominated by complement activation and blood coagulation components, transporters and protease inhibitors. The enriched proteome of human lymph (72 proteins) consisted of products derived from the extracellular matrix, apoptosis and cellular catabolism. In contrast, the enriched proteome of human plasma (37 proteins) consisted of soluble molecules of the coagulation system and cell-cell signaling factors. The functional networks associated with both common and source-distinctive proteomes highlight the principal biological activity of these immunologically relevant body fluids.


Figures

Fig. 1
Fig. 1
Comparative 2D-DIGE proteomics profiles of human lymph and plasma. A) 2D-DIGE image of proteins expressed in plasma (Cy3 green fluorescence) and lymph (Cy5 red fluorescence). One out of three independent experiments is shown. (B) 2D-DIGE of differentially expressed lymph and plasma proteins. The green spots represent proteins up-regulated in plasma while red spots indicate proteins up-regulated in lymph. Circles indicate proteins having at least a 3.0 fold change in fluorescence expression index (defined as the ratio lymph/plasma). These proteins were excised from the gel and subjected to nanoLC–ESI–MS/MS analysis. Nineteen protein spots were selected with a lymph/plasma ratio above 4.2 and are presented in Table 1 (11 spots are displayed in Fig. 1B and 8 spots are displayed in Supplementary Fig. 1). Proteins with at least a 3.0 fold change in the lymph/plasma fluorescence index are presented in Supplementary Table 1. (C) 3D view of individual spots of proteins significantly up-regulated (≥+8.0 fold change) in the lymph as compared with the plasma following analysis using DeCyder software. Each protein is also reported in Table 1. The up-regulation of tetranectin (CLEC3B) expression in the lymph as compared with plasma was validated by Western analysis (Fig. 5). BAI-1 associated protein 2 was not yet validated by Western blot but its major unique peptide MS/MS fragmentation profile is included in Supplementary Fig. 3.
Fig. 2
Fig. 2
Analysis of the human lymph and plasma proteomes using 1DE SDS–PAGE coupled with nanoLC tandem MS/MS. A) Coomassie stained 4–15% SDS–PAGE of human lymph (9 individual patients and pooled sample from 18 patients) and B) human plasma (9 individual patients and pooled sample from 18 patients) (70 μg of total protein were run in each lane). Sixteen gel bands were excised from each lane; proteins were tryptic-digested and analyzed by nanoLC–ESI–MS/MS analysis. C) Venn diagram analysis of the proteomics profiles derived from 18 pooled lymph and matched plasma samples and from the combined analysis of 9 individual lymph and plasma samples (the non-redundant list of all proteins found in the lymph and plasma is shown in Table 2). D, E, F) Pie charts displaying the subcellular distribution of the D) lymph and plasma common proteome displayed in the Venn diagram (144 shared proteins). Numbers are calculated as percentage of the common 144 proteins (Table 2). Cellular distribution of the enriched proteomes found in the E) lymph and in the F) plasma (72 and 37 enriched proteins in the lymph and plasma respectively). Numbers are calculated as percentage of each enriched proteome. The proteins associated with the common 144 and the enriched proteins are shown in Table 2 (unknowns are included in the % distribution).
Fig. 3
Fig. 3
Functional networks analysis of the human lymph and plasma common and enriched proteomes. A) Pie chart of the human lymph and plasma major common functional networks. Data were generated using the IPA (ingenuity pathway analysis) software. The graphic display is generated from the common 144 proteins shown in Table 2. B) Pie chart of the human major lymph networks derived from the enriched lymph proteome is shown in Fig. 2C (72 proteins) and Table 2. C) Pie chart of the human major plasma functional networks derived from the enriched plasma proteome shown in Fig. 2C (32 proteins) and Table 2.
Fig. 4
Fig. 4
Network analysis of the proteins up-regulated in the lymph as detected by 2D-DIGE. Graphic display of the human lymph major networks, compiled from the list of proteins presented in Table 1 (A and B). Lists of the genes names and proteins analyzed in the networks are reported in Supplementary Table 2. Highlighted in yellow are the hits validate by Western blot analysis shown in Fig. 5.
Fig. 5
Fig. 5
Western blot analysis of selected lymph proteins. Six major extracellular proteins (A) and 14 intracellular and plasma membrane associated proteins (B), found to be expressed at higher level in the lymph vs. the plasma, were validated by Western blot analysis. Lp and Pp indicate pooled samples of lymph and plasma, respectively, from 18 healthy donors. L3–L5 and P3–P5 are individual samples from lymph and plasma, from different donors.

Similar articles

Cited by

References

    1. Heim WJ. On the chemical composition of lymph from subcutaneous vessels. Cambridge, Mass: Harvard University Press; 1932. pp. 553–8.
    1. Sixt M, Kanazawa N, Selg M, Samson T, Roos G, Reinhardt DP, et al. The conduit system transports soluble antigens from the afferent lymph to resident dendritic cells in the T cell area of the lymph node. Immunity. 2005;22:19–29. - PubMed
    1. Roozendaal R, Mempel TR, Pitcher LA, Gonzalez SA, Verschoor S. Conduits mediate transport of low-molecular-weight antigen to lymph node follicles. Immunity. 2009;30:264–76. - PMC - PubMed
    1. Gretz JE, Kaldjian EP, Anderson AO, Shaw S. Sophisticated strategies for information encounter in the lymph node: the reticular network as a conduit of soluble information and a highway for cell traffic. J Immunol. 1996;157:495–9. - PubMed
    1. Leak LV, Liotta LA, Krutzsch H, Jones M, Fusaro VS, Ross SJ, et al. Proteomic analysis of lymph. Proteomics. 2004;4:753–65. - PubMed

Publication types

LinkOut - more resources