. 2013 Jan;10(1):77-83.
doi: 10.1038/nmeth.2255. Epub 2012 Dec 2.

Conversion of human fibroblasts to angioblast-like progenitor cells

Affiliations

Conversion of human fibroblasts to angioblast-like progenitor cells

Leo Kurian et al. Nat Methods. 2013 Jan.

Erratum in

  • Author Correction: Conversion of human fibroblasts to angioblast-like progenitor cells.
    Kurian L, Sancho-Martinez I, Nivet E, Aguirre A, Moon K, Pendaries C, Volle-Challier C, Bono F, Herbert JM, Pulecio J, Xia Y, Li M, Montserrat N, Ruiz S, Dubova I, Rodriguez C, Denli AM, Boscolo FS, Thiagarajan RD, Gage FH, Loring JF, Laurent LC, Belmonte JCI. Kurian L, et al. Nat Methods. 2020 Mar;17(3):353. doi: 10.1038/s41592-020-0745-8. Nat Methods. 2020. PMID: 32034376

Abstract

Lineage conversion of one somatic cell type to another is an attractive approach for generating specific human cell types. Lineage conversion can be direct, in the absence of proliferation and multipotent progenitor generation, or indirect, by the generation of expandable multipotent progenitor states. We report the development of a reprogramming methodology in which cells transition through a plastic intermediate state, induced by brief exposure to reprogramming factors, followed by differentiation. We use this approach to convert human fibroblasts to mesodermal progenitor cells, including by non-integrative approaches. These progenitor cells demonstrated bipotent differentiation potential and could generate endothelial and smooth muscle lineages. Differentiated endothelial cells exhibited neo-angiogenesis and anastomosis in vivo. This methodology for indirect lineage conversion to angioblast-like cells adds to the armamentarium of reprogramming approaches aimed at the study and treatment of ischemic pathologies.


Figures
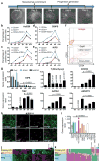
Figure 1
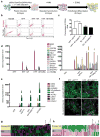
Figure 1. Differentiation of hPSCs into mesodermal progenitor and terminally differentiated endothelial cells
a) Scheme and Representative bright field pictures during the course of differentiation of human pluripotent stem cells towards CD34+ progenitor cells. b–e) Flow cytometry analysis of the mesoderm markers CD34 and CD31 over the differentiation course on HuES9 embryonic stem cells (b), H1 embryonic stem cells (c), two-factor cord blood-derived iPS cells (CBiPS) (d) and four factor keratinocyte-derived iPS (KiPS) (e). Representative flow cytometry plots depicting a double CD34+CD31+ population obtained after 8 days of PSC differentiation in the presence of Mesodermal Induction Media (MIM). Upper panel shows isotype controls. Lower panel shows specific CD34 and CD31 staining (f). g) mRNA fold-change of pluripotency and mesodermal markers on KiPS. h) Fluorescence microscopy analysis showing the expression of indicated endothelial cell markers in KiPS derived Endothelial Cells (KiPSEndo). i) mRNA expression profile showing specific upregulation of endothelial markers in KiPSEndo. j–k) Heat-map and representative clustering of hPSCs as compared to induced/differentiated endothelial (iECs) as well as a representative primary endothelial cell line (Human Umbilical Vein Endothelial Cells; HUVEC). On the left, genome-wide transcriptome analysis results demonstrate high similarities between PSC-differentiated and primary endothelial cells (j). On the right, genome-wide methylation profiling representing the epigenetic changes occurring upon differentiation of PSCs into endothelial cells (iECs). Generated endothelial cells cluster closely to primary endothelial cells (k). See Supplementary Table 2 for specific gene-expression changes as summarized in the main figure panels. Error bars, s.d. Scale bars: 200 μm (a), 50μm (h). Endoglin and VE-cadherin stainings are depicted in green; vWF stainings are depicted in magenta; Nuclear stainings are depicted in blue.
Figure 2
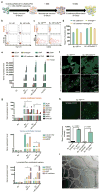
Figure 2. Conversion of human fibroblasts into mesodermal progenitor and terminally differentiated endothelial cells by retroviral approaches
a) Schematic representation of the conversion process towards CD34+ progenitor cells and further differentiation into terminally differentiated endothelial cells. b) Representative flow cytometry plots demonstrating absent expression of pluripotency-associated markers upon plastic induction followed by Mesodermal Induction Media (MIM) differentiation. c) Flow cytometry analysis of CD34 expression after MIM induction in neonatal human fibroblasts in the presence of miR302-367 or the respective scramble controls. d) mRNA expression profiling of mesodermal genes upon the first phase of “plastic induction” (left panels); mRNA expression profiling of mesodermal genes upon “plastic induction” followed by MIM differentiation (right panels). Note the significant upregulation of all mesodermal and angioblast-related markers upon MIM exposure. e) mRNA expression profile showing specific upregulation of Endothelial Cell (EC) markers upon specific differentiation of sorted FibCD34+ cells into “converted” ECs. f) Fluorescence microscopy analysis showing the expression of the indicated endothelial markers in converted cells. g–h) Heat-map and representative clustering of the initial fibroblasts population as compare to converted FibCD34+ cells, endothelial cells (cECs) and a representative primary endothelial cell line (Human Umbilical Vein Endothelial Cells; HUVEC). On the left, genome-wide transcriptome analysis results demonstrating high similarities between converted and primary endothelial cells (g). On the right, genome-wide methylation profiling representing the epigenetic changes occurring upon conversion into converted endothelial cells. Converted endothelial cells (cECs) cluster closely to primary endothelial cells (h). See Supplementary Table 2 for specific gene-expression changes as summarized in the main figure panels. Scale bars: 50μm (f). Error bars, s.d. *P<0.05. Endoglin and VE-cadherin stainings are depicted in green; vWF stainings are depicted in magenta; Nuclear stainings are depicted in blue.
Figure 3
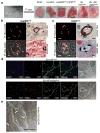
Figure 3. Conversion of human fibroblasts into mesodermal progenitor and terminally differentiated endothelial cells by non-integrative approaches
a) Schematic representation of the conversion process towards CD34+ progenitor cells and further differentiation into terminally differentiated endothelial cells. b) Representative flow cytometry plots demonstrating absent expression of pluripotency-associated markers upon plastic induction with non-integrative plasmids followed by Mesodermal Induction Media (MIM) differentiation. c) Representative flow cytometry analysis of CD34 expression before and after MIM differentiation in human fibroblasts (BJ) induced to a plastic state by the use of non-integrative approaches in the presence of miR302-367 or respective scramble controls. Upper panel shows isotype controls. Lower panel shows specific CD34. d) Representative flow cytometry quantification of BJ-converted VE-cadherin+ and endoglin+ endothelial cells derived in the presence of miR302/367 or respective scramble controls. e) mRNA expression profile showing specific upregulation of endothelial markers upon specific differentiation of sorted BJ FibCD34+ cells into “converted” endothelial cells. f) Fluorescence microscopy analysis showing the expression of the indicated endothelial markers in converted cells. g) Characterization of endothelial subtypes in BJ converted endothelial cells. Note the mixed expression of different endothelial subtype markers including arterial, venous and lymphatic upon conversion of fibroblasts. h) Representative pictures of endothelial cells derived by non-integrative approaches upon LDL uptake as compared to the respective controls (upper panels). LDL Mean Fluorescence Intensities of BJ-derived endothelial cells that were converted by non-integrative approaches (lower panels). Controls represent converted endothelial cells in the presence of Alexa Fluor 488 in order to measure unspecific fluorescence background. i) BJ-derived endothelial cells converted by non-integrative approaches spontaneously formed capillary-like structures in vitro. See Supplementary Table 2 for specific gene-expression changes as summarized in the main figure panels. Scale bars: 50 μm (f); 100μm (h); 200μm (i). Error bars, s.d. *P<0.05. Endoglin and VE-cadherin stainings are depicted in green; vWF stainings are depicted in magenta; Nuclear stainings are depicted in blue.
Figure 4
Figure 4. Generated Endothelial cells demonstrate functionality in vivo
a) 17 days after injection, matrigel plugs were extracted and processed for analyses. Pictures show increased blood circulation through the extracted plugs, thus demonstrating connection with the pre-existing vasculature (anastomosis) in vivo. b, c) Representative pictures of HuES9- (left panels) and KiPS- (right) derived endothelial cells showing the identification of human cells by in situ hybridization on ALU+ sequences (dark blue dot), anti-human CD31 staining (brown) and Ulex Lectin rhodamine staining (red). Note the presence of circulating red blood cells through the vessel-graft. d) Endothelial cells derived by non-integrative approaches-mediated conversion of human fibroblasts demonstrate anastomosis in vivo. Human specific CD31 antibody demonstrates the presence of converted endothelial cells (green). Co-localization with specific Human Nuclear Antigen staining demonstrates that the generated vessels are derived from the injected converted human endothelial cells. e) Representative high magnification picture demonstrating connection to the pre-existing vasculature upon injection of converted endothelial cells generated by non-integrative approaches. White arrows indicate the presence of circulating red blood cells. Scale bars: 5 μm (b, c); 50μm (d, e). CD31 stainings are depicted in green; Human Nuclear Antigen (HuNu) stainings are depicted in magenta; Nuclear stainings are depicted in blue.

Comment in

References

    1. Sancho-Martinez I, Nivet E, Izpisua Belmonte JC. The labyrinth of nuclear reprogramming. J Mol Cell Biol. 2011;3:327–329. - PMC - PubMed
    1. Takahashi K, Yamanaka S. Induction of pluripotent stem cells from mouse embryonic and adult fibroblast cultures by defined factors. Cell. 2006;126:663–676. - PubMed
    1. Laiosa CV, Stadtfeld M, Xie H, de Andres-Aguayo L, Graf T. Reprogramming of committed T cell progenitors to macrophages and dendritic cells by C/EBP alpha and PU.1 transcription factors. Immunity. 2006;25:731–744. - PubMed
    1. Ieda M, et al. Direct reprogramming of fibroblasts into functional cardiomyocytes by defined factors. Cell. 2010;142:375–386. - PMC - PubMed
    1. Vierbuchen T, et al. Direct conversion of fibroblasts to functional neurons by defined factors. Nature. 2010;463:1035–1041. - PMC - PubMed

Publication types

MeSH terms

Associated data