. 2013 Jan;123(1):224-35.
doi: 10.1172/JCI64516. Epub 2012 Dec 3.

Inhibition of GSK3β-mediated BACE1 expression reduces Alzheimer-associated phenotypes

Affiliations

Inhibition of GSK3β-mediated BACE1 expression reduces Alzheimer-associated phenotypes

Philip T T Ly et al. J Clin Invest. 2013 Jan.

Abstract

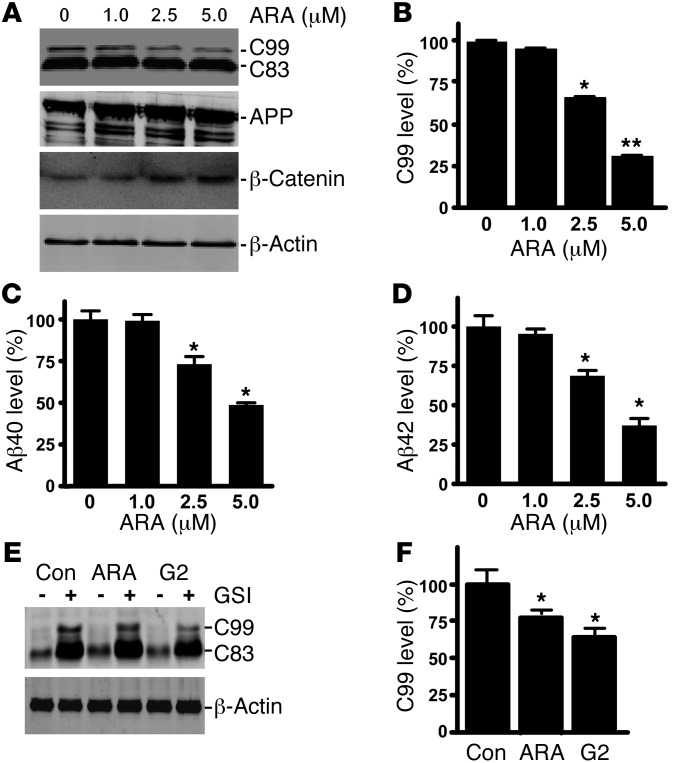
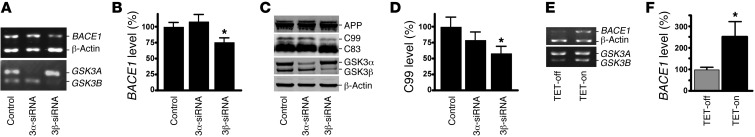
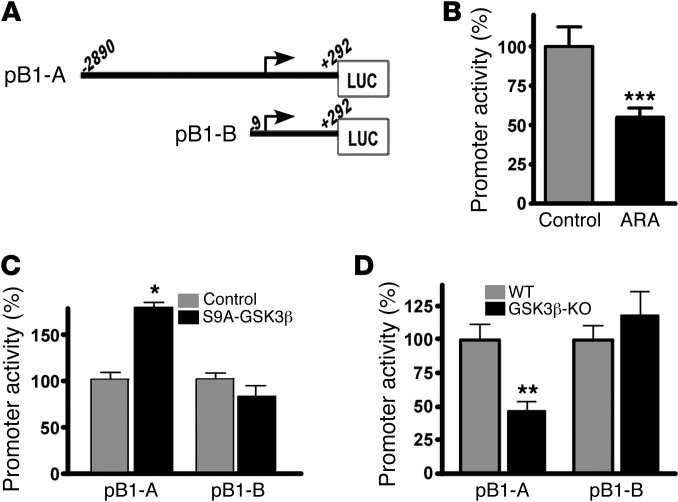
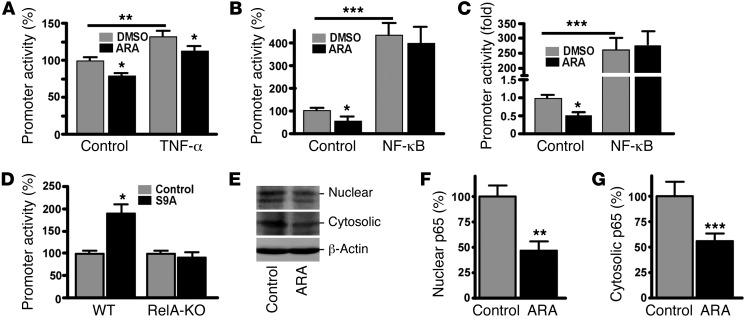
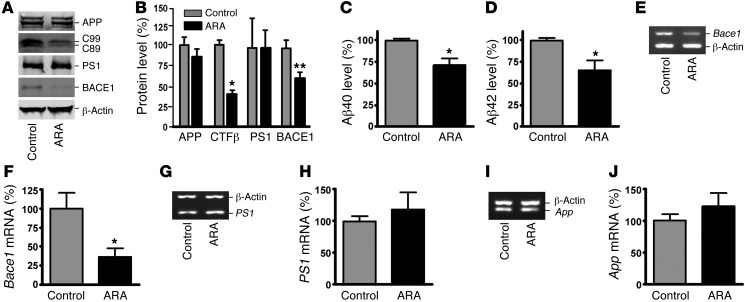
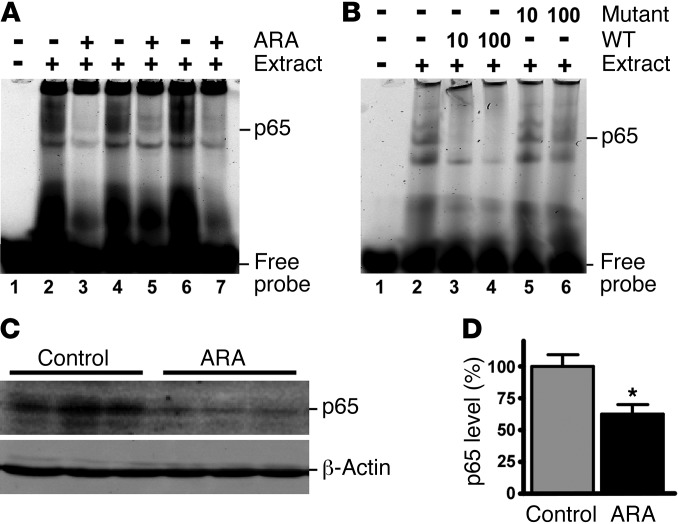
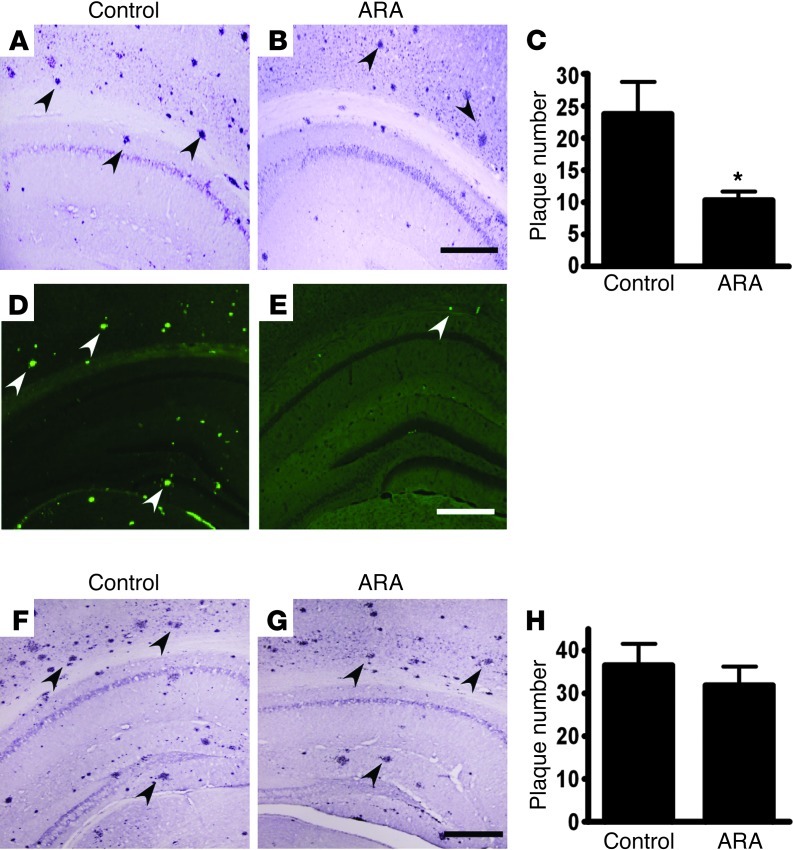
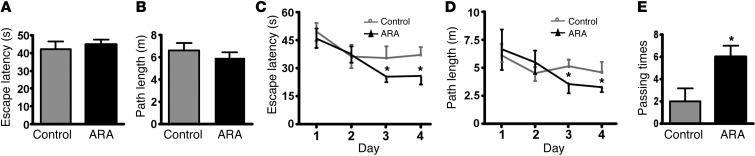
Deposition of amyloid β protein (Aβ) to form neuritic plaques in the brain is the pathological hallmark of Alzheimer's disease (AD). Aβ is generated from sequential cleavages of the β-amyloid precursor protein (APP) by the β- and γ-secretases, and β-site APP-cleaving enzyme 1 (BACE1) is the β-secretase essential for Aβ generation. Previous studies have indicated that glycogen synthase kinase 3 (GSK3) may play a role in APP processing by modulating γ-secretase activity, thereby facilitating Aβ production. There are two highly conserved isoforms of GSK3: GSK3α and GSK3β. We now report that specific inhibition of GSK3β, but not GSK3α, reduced BACE1-mediated cleavage of APP and Aβ production by decreasing BACE1 gene transcription and expression. The regulation of BACE1 gene expression by GSK3β was dependent on NF-κB signaling. Inhibition of GSK3 signaling markedly reduced Aβ deposition and neuritic plaque formation, and rescued memory deficits in the double transgenic AD model mice. These data provide evidence for regulation of BACE1 expression and AD pathogenesis by GSK3β and that inhibition of GSK3 signaling can reduce Aβ neuropathology and alleviate memory deficits in AD model mice. Our study suggests that interventions that specifically target the β-isoform of GSK3 may be a safe and effective approach for treating AD.


Figures

Figure 1
Figure 1. Specific inhibition of GSK3 reduces BACE1 cleavage of APP.
(A) Swedish mutant APP stable cell line 20E2 was cultured and treated with ARA for 24 hours, and cell lysates subjected to Western blot analysis. Full-length APP and the APP CTFs were detected with C20 antibody. β-Catenin was detected by anti–β-catenin antibody. β-Actin was detected by anti-actin antibody AC-15 as the internal control. (B) Quantification of APP C99 generation in 20E2 cells. ARA treatment significantly increased β-catenin levels in a dose-dependent manner, while APP C99 production decreased with increasing ARA dosage. n = 6; *P < 0.05 and **P < 0.01, ANOVA. Aβ ELISA detection of Aβ40 (C) and Aβ42 (D) in conditioned medium from 20E2 cells treated with ARA for 24 hours. ARA treatment reduced Aβ levels in the conditioned medium in a dose-dependent manner. The values are expressed as mean ± SEM. n = 4; *P < 0.05, ANOVA. (E) γ-Secretase activity in 20E2 cells was inhibited by the pharmacological inhibitor L685,458 (GSI). Co-treatment with specific GSK3 inhibitors ARA and G2 reduced C99. Con, control. (F) Quantification of C99 levels. n = 6; *P < 0.05, ANOVA.
Figure 2
Figure 2. GSK3β, but not GSK3α, regulates BACE1 gene expression and APP processing.
(A) SH-SY5Y human neuroblastoma cells were transfected with scrambled GSK3α or GSK3β isoform–specific siRNA. RNA was extracted, and semiquantitative RT-PCR was performed to measure endogenous human BACE1, GSK3A, GSK3B, and β-actin mRNA levels with specific primers recognizing the coding sequence of each gene. PCR products after 28 cycles were analyzed on 1.2% agarose gel. (B) Endogenous BACE1 mRNA was significantly reduced with GSK3β, but not GSK3α, isoform–specific knockdown. The values are expressed as mean ± SEM. n = 3; *P < 0.05, Student’s t test. (C) 20E2 cells were transfected with scrambled or GSK3α, or GSK3β isoform–specific siRNA while cotreated with L685,458 to block γ-secretase activity. Full-length APP and CTF fragments were detected with C20 antibody. GSK3α and GSK3β were detected using a monoclonal GSK3α/β antibody. GSK3α and GSK3β isoforms were selectively reduced by the isoform-specific siRNA. β-Actin served as an internal control and was detected using a monoclonal anti–β-actin antibody, AC-15. (D) GSK3β-specific knockdown significantly reduced C99 levels. GSK3α-specific knockdown did not have any significant effect. The values are expressed as mean ± SEM. n = 4; *P < 0.05, Student’s t test. (E) Tetracycline-regulated SHSY5Y cells were induced to express constitutively active S9A-GSK3β. Endogenous human BACE1 mRNA levels were assessed as described above. Tetracyline-induced S9A-GSK3β significantly increased BACE1 expression. (F) Quantification of the endogenous BACE1 mRNA level. Values are expressed as mean ± SEM. n = 4; *P < 0.05, Student’s t test.
Figure 3
Figure 3. GSK3β regulates BACE1 promoter activation.
(A) Schematic of the 3.3-kb (pB1-A) and 300-bp (pB1-B) human BACE1 promoter/luciferase construct. (B) The 3.5-kb human BACE1 promoter was transfected into N2a cells and treated with 5 μM ARA. GSK3 inhibition with ARA treatment resulted in a significant decrease in luciferase activity. (C) N2a cells were co-transfected with either promoter constructs and S9A-GSK3β or a vector control. S9A-GSK3β significantly increased the luciferase activity of the 3.3-kb BACE1 promoter construct but did not have any effect on the 300-bp promoter construct. (D) pB1-A or pB1-B constructs were transfected into Gsk3b-KO MEFs. pB1-A had significantly reduced promoter activity. All promoter data shown represent an average of at least 4 independent experiments, with each condition performed in triplicate. Values are expressed as mean ± SEM. n = 4; *P < 0.05, **P < 0.01, ***P < 0.005, Student’s t test.
Figure 4
Figure 4. GSK3β regulation of BACE1 transcription is dependent on NF-κB p65 expression.
(A) pBACE1-4NF-κB plasmid contains the 4 NF-κB cis-elements from the human BACE1 promoter upstream of the firefly luciferase reporter gene. N2a cells were co-transfected with pBACE1-4NF-κB and pCMV-RLuc. Transfected cells were treated with vehicle solution (control) or 10 ng/ml TNF-α with/without 5 μM ARA for 24 hours. (B) N2a cells were co-transfected with pBACE1-4NF-κB plasmid and pMTF-p65 or a vector control. Transfected cells were then treated with a vehicle solution or 5 μM ARA for 24 hours. (C) pNF-κB-Luc was co-transfected with pMTF-p65 or a vector control and treated with a vehicle solution or 5 μM ARA for 24 hours. Renilla luciferase was used to normalize for transfection efficiency. Values are expressed as mean ± SEM. n = 4; *P < 0.05, **P < 0.01, ***P < 0.001, Student’s t test. (D) Wild-type MEFs and RelA-KO MEFs which are dysfunctional for NF-κB activity, were co-transfected with a 3.5-kb human BACE1 promoter and S9A-GSK3β or a control vector. S9A-GSK3β overexpression in MEFs. significantly increased luciferase activity (*P < 0.05, Student’s t test), whereas RelA-KO MEFs did not have any significant effect. Luciferase activity is indicative of BACE1 promoter activity. All promoter data shown represent an average of at least 4 independent experiments, with each condition performed in triplicate. (E) N2a cells were treated with 5 μM ARA for 24 hours, followed by cell fractionation. Cytosolic and nuclear fractions were subjected to SDS-PAGE. ARA treatment significantly reduced NF-κB p65 levels in the (F) nuclear fraction (n = 6; **P < 0.001, Student’s t test) and (G) cytosolic fraction. n = 6; ***P < 0.001, Student’s t test. Values are expressed as mean ± SEM.
Figure 5
Figure 5. ARA inhibits BACE1 cleavage of APP and Aβ production in vivo.
(A) Hemi-brains from ARA-treated and control APP23/PS45 mice of the 6 weeks age group were homogenized in RIPA-Doc lysis buffer and separated with 12% Tris-glycine or 16% Tris-tricine SDS-PAGE. Full-length APP and APP CTFs (C99 and C89) were detected by C20 polyclonal antibody. PS1 was detected by anti-PS1 N-terminal antibody 231. BACE1 was detected by anti-BACE1 antibody. β-Actin was detected by anti–β-actin antibody AC-15 as the internal control. (B) Quantification showed that CTFβ was significantly decreased in ARA-treated mice. n = 25 mice total. *P < 0.05, **P < 0.01, Student’s t test. ELISA was performed to measure Aβ40 (C) and Aβ42 (D) levels from the brain tissues of APP23/PS45 mice injected with or without ARA. n = 8 for each group; *P < 0.005, Student’s t test. (E) Total RNA was isolated from APP23/PS45 mouse cortices by TRI Reagent. Sets of gene-specific primers were used to amplify Bace1 (E), PS1 (G), and App (I) genes. β-Actin was used as an internal control. Bace1 mRNA levels were significantly reduced (F), while there were no difference in endogenous PS1 (H) or App (J) mRNA levels between ARA-treated mice and controls. Values are expressed as mean ± SEM. n = 12 total; *P < 0.01, Student’s t test.
Figure 6
Figure 6. ARA reduced NF-κB binding in APP23/PS45 mouse brains.
APP23/PS45 mice were injected daily with ARA for 4 weeks, and whole brain lysates were subjected to EMSA. (A) Mice that received ARA had reduced intensity of NF-κB shifted band. n = 3. (B) Whole brain lysates subjected to EMSA was competed with 10- and 100-fold excess of the wild-type and mutant NF-κB oligos to demonstrate the specificity of binding. (C) Daily injections of ARA to APP23/PS45 mice for 6 weeks reduced NF-κB p65 levels in the whole brain lysates. (D) Quantification of the band intensity of NF-κB p65 levels. Values are expressed as mean ± SEM. n = 25 total; *P < 0.005.
Figure 7
Figure 7. AR-A014418 treatment significantly reduces neuritic plaque formation in AD transgenic mice.
(A and B) APP23/PS45 double transgenic mice at the age of 6 weeks were treated with ARA (5 mg/kg) for 4 weeks, while age-matched control APP23/PS45 mice received vehicle solution. The mice were sacrificed after behavioral tests, and the brains were dissected, fixed, and sectioned. Neuritic plaques were detected using Aβ specific monoclonal antibody 4G8 (Signet). The plaques were visualized by microscopy with ×40 magnification. (A) A representative brain section of the control and (B) AR-A014418 injected APP23/PS45 mice sacrificed immediately after behavioral analysis. Black arrows point to plaques. Bars: 500 μm. The number of neuritic plaques was significantly reduced in AR-A014418 treated mice compared to controls. (C) Quantification of neuritic plaques in APP23/PS45 mice with treatment starting at the age of 6 weeks and sacrificed immediately after behavioral analysis, the number represents mean ± SEM, n = 22 mice total, *P < 0.01 by Student’s t-test. (D and E) Neuritic plaques were further confirmed using thioflavin S fluorescent staining and visualized by microscopy with a ×40 objective. There were less neuritic plaques in AR-A014418 treated mice (E) as compared to age matched control mice (D) sacrificed immediately after AR-A014418 injection. White arrows point to green fluorescent neuritic plaques. Bar: 500 μm. (F and G) Plaque formation in APP23/PS45 mice was further examined using 4G8 antibody staining 3 months after the last injection. (F) A representative brain section of control or (G) AR-A014418 injected APP23/PS45 mice sacrificed 3 months after the last injection. (H) Quantification of neuritic plaques in APP23/PS45 mice 3 months after the last injection. The number represents mean ± SEM, n = 12 mice total, P > 0.05 by Student’s t-test.
Figure 8
Figure 8. ARA improves memory deficits in AD transgenic mice.
A Morris water maze test consists of 1 day of visible platform trials and 4 days of hidden platform trials, plus a probe trial 24 hours after the last hidden platform trial. Animal movement was tracked and recorded by ANY-maze tracking software. APP23/PS45 mice at 6 weeks were injected daily for 1 month with ARA or a vehicle solution and subjected to the Morris water maze test (n = 26 mice total, 14 ARA-treated and 12 sham-treated). (A) During the first day of visible platform tests, the ARA treated and control APP23/PS45 mice exhibited a similar latency to escape onto the visible platform. P > 0.05, Student’s t test. (B) The ARA-treated and control APP23/PS45 mice had similar swimming distances before escaping onto the visible platform in the visible platform test. P > 0.05, Student’s t test. (C) In hidden platform tests, mice were trained with 5 trials per day for 4 days. ARA-treated APP23/PS45 mice showed a shorter latency to escape onto the hidden platform on the third and fourth days. *P < 0.05, Tukey’s post hoc analysis. (D) The ARA-treated APP23/PS45 mice had a shorter swimming length before escaping onto the hidden platform on the third and fourth days. *P < 0.05, Tukey’s post hoc analysis. (E) In the probe trial on the sixth day, the ARA-treated APP23/PS45 mice traveled into the third quadrant, where the hidden platform was previously placed, significantly more times than controls. Values are expressed as mean ± SEM.*P < 0.05, Student’s t test.

References

    1. Sinha S, et al. Purification and cloning of amyloid precursor protein beta-secretase from human brain. Nature. 1999;402(6761):537–540. doi: 10.1038/990114. - DOI - PubMed
    1. Hussain I, et al. ASP1 (BACE2) cleaves the amyloid precursor protein at the beta-secretase site. Mol Cell Neurosci. 2000;16(5):609–619. doi: 10.1006/mcne.2000.0884. - DOI - PubMed
    1. Yan R, et al. Membrane-anchored aspartyl protease with Alzheimer’s disease beta-secretase activity. Nature. 1999;402(6761):533–537. doi: 10.1038/990107. - DOI - PubMed
    1. Vassar R, et al. Beta-secretase cleavage of Alzheimer’s amyloid precursor protein by the transmembrane aspartic protease BACE. Science. 1999;286(5440):735–741. doi: 10.1126/science.286.5440.735. - DOI - PubMed
    1. Li Y, Zhou W, Tong Y, He G, Song W. Control of APP processing and Abeta generation level by BACE1 enzymatic activity and transcription. FASEB J. 2006;20(2):285–292. doi: 10.1096/fj.05-4986com. - DOI - PubMed

Publication types

MeSH terms