. 2013 Jan 9;32(1):30-44.
doi: 10.1038/emboj.2012.305. Epub 2012 Nov 30.

Mirror-symmetric microtubule assembly and cell interactions drive lumen formation in the zebrafish neural rod

Affiliations

Mirror-symmetric microtubule assembly and cell interactions drive lumen formation in the zebrafish neural rod

Clare E Buckley et al. EMBO J. .

Abstract

By analysing the cellular and subcellular events that occur in the centre of the developing zebrafish neural rod, we have uncovered a novel mechanism of cell polarisation during lumen formation. Cells from each side of the neural rod interdigitate across the tissue midline. This is necessary for localisation of apical junctional proteins to the region where cells intersect the tissue midline. Cells assemble a mirror-symmetric microtubule cytoskeleton around the tissue midline, which is necessary for the trafficking of proteins required for normal lumen formation, such as partitioning defective 3 and Rab11a to this point. This occurs in advance and is independent of the midline cell division that has been shown to have a powerful role in lumen organisation. To our knowledge, this is the first example of the initiation of apical polarisation part way along the length of a cell, rather than at a cell extremity. Although the midline division is not necessary for apical polarisation, it confers a morphogenetic advantage by efficiently eliminating cellular processes that would otherwise bridge the developing lumen.


Conflict of interest statement

The authors declare that they have no conflict of interest.

Figures

Figure 1
Figure 1
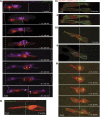
Apical polarisation of cells at the tissue midline begins prior to the C-division. Dotted lines: midlines. Dashed lines: basal edges. (A) Time-lapse sequence showing a neural rod cell prior to, during and following C-division. Prior to division, the cell extends across the tissue centre and Pard3–GFP puncta broadly localise around the region where the cell intersects this point. Pard3–GFP puncta are biased to the medial side of the cell at metaphase but subsequently are found at the cleavage plane between daughters (17/17 cells from six embryos) and later more precisely to the nascent apical surface (arrow). The first and last images are duplicated with the bright field shown in grey. The Pard3–GFP channel is shown separately and enlarged to the right. See also Supplementary Movie S1. (B) Dot plot showing distribution of midline crossing divisions from three embryos relative to their tissue midline (zero on y axis). Over time, the location of divisions near the midline becomes more precise. (C) Pard3–GFP puncta localise to the cleavage furrow in cells dividing very close to the midline (11/12 cells from six embryos). (D) Pard3–GFP puncta are biased to the medial side of cells that divide lateral to the midline (18/20 cells from six embryos). Pard3-GFP then progressively localises to the cleavage plane between the two daughter cells.
Figure 2
Figure 2
Apical polarisation of cells at the tissue midline is independent of cell division. Dotted lines: midlines. (A) Division-blocked cells in emi1MO embryos frequently stretch completely across the width of the neural rod (36/84 from 5 emi1MO embryos, compared to 18/112 cells before C-division in six control embryos). Arrows indicate left and right sides of rod. (B–D) Time-lapse sequences of Pard3–GFP puncta localising close to the region where division-blocked cells intersect the tissue midline. Pard3–GFP locates to the tissue midline irrespective of the length of the cells’ contralateral process (44/44 cells from seven embryos: B=16 cells, C=10 cells and D=18 cells). See also Supplementary Movie S2. (E) Single Z-section demonstrates that puncta of ZO1 protein also appear at the region where division-blocked cells intersect the midline. The mGFP channel is shown separately with the outlines of individual example cells highlighted. (F) Time-lapse sequence of a division-blocked cell labelled with DCX–GFP. 23/23 cells from five embryos that extended beyond the tissue midline underwent microtubule reorganisation (arrow) close to the point at which the cell intersects the midline. Seven of these cells consequently retracted their contralateral microtubule bundles. See also Supplementary Figure S1.
Figure 3
Figure 3
A mirror-symmetric microtubule cytoskeleton is organised around the tissue midline. Dotted lines: midlines. Dashed lines: basal edges. (A) Time-lapse sequence of centrosomal and nuclear movement within two cells from a wild-type embryo. The centrosomes (small arrows) from both cells gradually move towards the tissue midline. The initially lateral nuclei then relocate medially to the centrosomes, the centrosomes duplicate (arrowheads) and division occurs close to the midline (e.g., see nucleus from the lower cell, marked with an asterisk). The duplicated sister cells then extend towards the basal sides of the neural rod, locating their cleavage planes more precisely at the tissue midline and the centrosomes locate just laterally to each side of the midline (arrowheads). Of 24 cells from five embryos that extended across or near the tissue midline, 19 cells located their centrosomes close to the tissue midline and divided at this location. The division location of the five cells that divided more laterally was still coincident with the location of their centrosomes. (B) A division-blocked cell labelled with CENTRIN–GFP. Six out of six cells that extended beyond the tissue midline from three embryos localised their centrosomes close to the point at which they intersected the midline. Two spots of CENTRIN–GFP represent the duplicated centrosomes resulting from the emi1MO-blocking M-phase entry. (C, D) EB3–GFP-labelled cells showing plus-end-directed growing microtubule comets. (Ci) A single z-plane of two division-blocked cells at a single time point. (Cii) A projection of 20 sequential time points from a single z-plane. Microtubule comets grew from MTOCs, located close to midline. Arrows mark the path taken by selected microtubule comets. Seven out of seven cells that extended across the middle of the tissue from one embryo had a mirror reversal of microtubule polarity close to the tissue centre (see also Supplementary Movie S3). (Di) A z-projection of one wild-type cell at a single time point prior to division. (Dii) A projection of 29 sequential time points from a stack of six z-planes. A similar location of MTOCs close to the midline and a reversal of microtubule polarity around the tissue midline were seen in control cells prior to division. Arrows mark the path taken by selected microtubule comets. Fourteen out of fourteen cells from six embryos that extended across the middle of the tissue had a mirror reversal of microtubule polarity close to the tissue centre (see also Supplementary Movie S4). (Diii) A time-lapse sequence of the same cell as it carries out the C-division. After division, the MTOCs are gradually repositioned towards the midline. Fourteen out of fourteen pairs of cells from seven embryos repositioned their MTOCs close to the midline.
Figure 4
Figure 4
Pard3 fusion proteins are mislocalised basally with nocodazole treatment. Dotted lines: midlines. Dashed lines: basal edges. (A) Dorsal view of DCX–GFP-labelled NP cells within the hindbrain of a division-blocked embryo treated with nocodazole from the 6-somite stage. After 10 min treatment, the microtubule cytoskeleton is still intact, with long DCX fibres present along the whole length of the cells. After 95 min, the microtubules are depolymerised, resulting in disorganised and fragmented DCX fibres. (Bi) Low-magnification dorsal view of right-hand side of neural rod. Some Pard3–RFP is present apically before treatment as well as 15 min after treatment with nocodazole. However, Pard3–RFP appears at the basal end of cells (dashed line to right) after 105 min of nocodazole treatment. (Bii) Pard3–GFP is initially located at the apical pole (arrow) of this individual cell before treatment as well as 15 min after treatment with nocodazole. However, Pard3–GFP appears at the basal pole (arrowhead) within 75 min of nocodazole treatment. (C) The percentage of cells expressing Pard3–FP only apically or not at all (blue) or at least partially basally (red) before and after nocodazole treatment. After nocodazole addition, 88% of cells contained some basal Pard3–FP, as opposed to 12% of cells in control embryos (P<0.0001, Fisher’s exact test). n=35 cells from three treated embryos and 28 cells from three control embryos. (Di) Recovery of apical Pard3–GFP (arrow) from basal (arrowhead) following nocodazole washout. (Dii) Recovery of apical Pard3–GFP from basal (arrowhead) following nocodazole washout. In this cell, Pard3–GFP puncta were seen to decorate and travel along filamentous structures (arrows). We monitored 16 out of 26 cells from four embryos that repositioned Pard3–GFP from a basal to apical position following nocodazole washout. The remaining cells either had an unclear morphology (n=3), delaminated from the epithelium (n=4) or died (n=3).
Figure 5
Figure 5
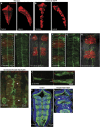
Pard3 and Rab11a are necessary for lumen formation. Dotted lines: midlines. Dashed lines: basal edges. (A, B) Three-dimensional reconstructions of dextran-filled brain ventricles from 28 h.p.f. wild-type (A) and Pard3-Δ6–EGFP (B) embryos. Ventricle morphology is severely disrupted in Pard3-Δ6–EGFP embryos. (C–H) A Krox20–RFP–KalTA4 control embryo (C–E) and a Krox20–RFP–KalTA4xUAS:mCherry–Rab11a–S25N embryo (F–H) labelled with Pard3–GFP in horizontal orientation. A z-projection of each embryo is shown at the 17-somite stage (C, F), with the GFP channel shown separately (D, G). Pard3–GFP is able to localise to the apical midline in both embryos but intensity levels appear slightly lower in DNRab11a rhombomeres 3 and 5 (F, G). A montage of images for each embryo is shown 8 h and 30 min later (26 h.p.f.), illustrating a single z-plane at the dorsal-most surface of the opening lumen (E, H). While the lumen opens normally in control embryos (E), opening does not occur in Rab11aDN rhombomeres 3 and 5 in dominant-negative embryos (H) (n=15/15 control embryos and 16/16 Rab11aDN embryos). (I) A projected stack of a division-blocked Krox20–RFP–KalTA4xUAS:mCherry–Rab11a–S25N 28-somite-stage embryo labelled with GFP–ZO1, H2B–RFP and CAAX-CHERRY in horizontal orientation. Disorganised lumen opening has started to occur in control rhombomeres 2, 4 and 6 but not in Rab11aDN rhombomeres 3 and 5. (J) Z-projection of mosaically labelled RAB11ADN–EGFP cells in a 22-somite stage neural rod. Pard3–RFP is localised normally to the apical end feet of the cells (e.g., arrow). (K–L) A projected stack of a Krox20–RFP–KalTA4 31 h.p.f. control embryo (K) and a Krox20–RFP–KalTA4xUAS:mCherry–Rab11a–S25N 31 h.p.f. embryo (L) labelled with ZO1 and sytox in horizontal orientation. White lines indicate the approximate position of the basal surfaces. A smooth lumen fully opens in control embryos (K), while in Rab11aDN embryos lumens lined by apical junctions were present in rhombomeres 2, 4 and 6 but no lumens were formed in rhombomeres 3 and 5 and junctional proteins were mislocalised (e.g., arrows) (L) (n=7/7 control embryos and 6/6 Rab11aDN embryos). See also Supplementary Figure S2.
Figure 6
Figure 6
RAB11A traffics to the point where cells intersect the tissue midline and is mislocalised following nocodazole treatment. Brightfield images are shown in grey. Dotted lines: midlines. Dashed lines: basal edges. (A) Time-lapse sequence of a control cell expressing RAB11A–EGFP and dividing across the tissue midline. RAB11A–EGFP puncta broadly accumulate within a 15 μm region close the tissue midline before C-division (n=15 cells from four embryos, s.e.=1.127 μm). The nucleus then moves to this point and the cell divides across the midline. RAB11A–EGFP puncta then redistribute around the apical ends of the sister cells. See also Supplementary Movie S5. (B) Time-lapse sequence of a division-blocked cell expressing RAB11A–EGFP. RAB11A–EGFP puncta are initially broadly distributed within an 18 μm region near the midline (n=13 cells from two embryos at 12 somites, s.e.=2.18 μm). Puncta then progressively accumulate more precisely to a 6-μm region near where the cell intersects the midline (n=9 cells from two embryos at 17 somites, s.e.=1.18 μm). This accumulation coincided spatially and temporally with the appearance of the cell reorganisation near the nascent apical surface (arrow). See also Supplementary Movie S6. (C) Division-blocked embryos were treated with nocodazole from early neural keel stages. The EGFP channel is shown separately. Before nocodazole treatment, RAB11A–EGFP was broadly distributed around the tissue centre. RAB11A–EGFP was basally mislocalised following nocodazole treatment (arrowheads).
Figure 7
Figure 7
Cells integrate anti-basal signals with cell–cell interactions to determine localisation of apical complexes. (Ai) Cartoon depicting physical separation of the two halves of the neural plate to delay convergence. Blue line is the plane of orientation for (Aii). (Aii) A single horizontal z-plane of the hindbrain of a division-blocked embryo at the 18-somite stage in which convergence has been delayed. Cells were labelled with mGFP and H2B–RFP and subsequently stained for ZO1 immunoreactivity. Where the left and right halves do not meet, ZO1 lines the superficial surface (arrowed) of the developing neuroepithelium. The superficial surface is seen en face on left-hand side (arrowhead). (Aiii) Reconstruction in the transverse plane of left–right separated tissue (approximately at level of dotted line in Ai), showing ZO1 at the superficial tip of neural cell. Arrow=midline. Quantification showed 33/33 cells from five embryos localised ZO1 strongly at their most anti-basal tip, situated at the superficial surface. (B) Horizontally orientated hindbrain of a division-blocked embryo at the 8-somite stage, labelled with Ctnna–citrine. (Bi) A single z-plane showing that Ctnna–citrine accumulates along the cell membrane and is not restricted to the anti-basal extremity of the cell (n=14 embryos). (Bii) Cells on one side of the neural keel were mosaically labelled and the signal intensity increased to clearly show the cell outline. (Biii) Cell morphologies (red) were mirrored (yellow) to create a predicted zone of interdigitation, overlying a z-projection of Ctnna–citrine. (Biv) The zone of interdigitation is indicated by dashed lines and closely reflects the zone over which cells localise Ctnna puncta. Between 10 and 25 interdigitating cells were used to define the zone of interdigitation in each embryo (n=8 embryos). (C) Horizontal 10-μm z-projection of 15-somite stage embryo hindbrains injected with control or Laminin C1 morpholino and labelled with ZO1 and DAPI. Laminin C1 morphants had large areas of basally mislocalised ZO1, (arrowheads, n=15), while control embryos never had basally located ZO1 (n=7).
Figure 8
Figure 8
Lumen surface is disrupted without division. (A) Maximum z-projections of control and division-blocked embryos showing the hindbrain at 18 h.p.f. and the spinal cord at 24 h.p.f. ZO1 immunoreactivity is shown separately in white and the otic vesicles are marked with asterisks. Control embryos had uninterrupted ZO1 along the midline. However, in division-blocked embryos the midline was interrupted by cell nuclei, resulting in gaps in ZO1 staining (arrows). This was found particularly prevalently but not exclusively at rhombomere boundaries. (B) Quantification of the number of gaps in ZO1 immunoreactivity at all dorsal–ventral levels in a 150 μm region of each embryo adjacent to the otic vesicle. A two-tailed unpaired t-test was used. There were significantly more gaps in emi1-MO embryos (3.1) than control-MO embryos (0.86). P<0.0001. n=7 for both groups. Data are represented as a mean+/−s.e.m. (C) Maximum projections of dorsally oriented 22 and 24 h.p.f. control and division-blocked embryos showed that lumen opening was disrupted and the lumen surface was ragged in division-blocked embryos. Lumen opening was particularly restricted at rhombomere boundaries (e.g., arrows). (D) Time-lapse sequence of a division-blocked cell showing the retraction of the contralateral process back to the shoulder region where the cell intersects the midline. This occurred in 58% (21/36) cells from five embryos. Bright field is shown in grey. The tissue midline is indicated by a dotted line.
Figure 9
Figure 9
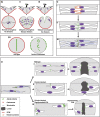
Graphical model of results. (A) Summary of results for the role of interdigitation in polarisation. When division-blocked cells interdigitate normally (Ai), they localise apical proteins at the tissue midline at neural keel/rod stages. When convergence is delayed to prevent cells from interdigitating at the midline, cells polarise and divide ectopically on either side of the midline to generate ectopic duplicated apical planes on either side of the midline (Aii). However when convergence is delayed to prevent cells from interdigitating at the midline and cell divisions are also blocked, then cells assemble apical proteins at their most anti-basal extremity, coincident with the superficial surface (Aiii). This suggests that the underlying apical polarisation of cells is anti-basal and that interdigitation is required to specifically localise this anti-basal polarisation around the point where cells intersect the tissue midline. (B) Summary of results for the role of the ECM in polarisation. When a normal ECM is present (Bi), apical proteins localise precisely to the tissue midline at neural rod stages. However, when ECM structure is disrupted (Bii), apical proteins are mislocalised basally. This suggests that the underlying anti-basal polarisation of NP cells is at least partly mediated by the ECM. (C) Model for a polarisation feedback loop. When cells interdigitate at the tissue midline at keel stages, we suggest that nascent adhesions are formed between contralateral cells (Ci). These could then recruit apical polarity protein puncta to the broad region of the midline (Cii), which in turn could recruit centrosomes. Centrosomes could then organise a mirror-symmetric microtubule cytoskeleton, which would reinforce and refine the localisation of apical proteins to the midline (Ciii), allowing the formation of mature junctions. (D) Summary of results for the role of division and the microtubule cytoskeleton in polarisation. (Di) In wild-type embryos, cells undergo the C-division near the midline, efficiently redistributing sister cells on either side of the developing rod and localising apical proteins to the nascent lumen surface at their point of connection at the midline. This therefore allows normal lumen opening. (Dii) When C-division is blocked, cells localise apical proteins to the tissue midline and some cells retract ectopic cell processes to the midline. However, this process is not efficient and many cells remain straddling the tissue midline. This therefore interrupts normal lumen opening. (Diii) If microtubules are depolymerised in division-blocked cells using nocodazole, apical proteins localise ectopically at the basal surface. If microtubules are allowed to reploymerise by washing out nocodazole, apical proteins relocalise at the apical surface and lumen opening occurs.

Comment in

References

    1. Baena-Lopez LA, Baonza A, Garcia-Bellido A (2005) The orientation of cell divisions determines the shape of Drosophila organs. Curr Biol 15: 1640–1644 - PubMed
    1. Bellett G, Carter JM, Keynton J, Goldspink D, James C, Moss DK, Mogensen MM (2009) Microtubule plus-end and minus-end capture at adherens junctions is involved in the assembly of apico-basal arrays in polarised epithelial cells. Cell Motil Cytoskeleton 66: 893–908 - PubMed
    1. Bryant DM, Datta A, Rodriguez-Fraticelli AE, Peranen J, Martin-Belmonte F, Mostov KE (2010) A molecular network for de novo generation of the apical surface and lumen. Nat Cell Biol 12: 1035–1045 - PMC - PubMed
    1. Cai Y, Yu F, Lin S, Chia W, Yang X (2003) Apical complex genes control mitotic spindle geometry and relative size of daughter cells in Drosophila neuroblast and pI asymmetric divisions. Cell 112: 51–62 - PubMed
    1. Capaldo CT, Macara IG (2007) Depletion of E-cadherin disrupts establishment but not maintenance of cell junctions in Madin-Darby canine kidney epithelial cells. Mol Biol Cell 18: 189–200 - PMC - PubMed

Publication types

MeSH terms