

Review
doi: 10.3390/ijms131012773.
Theoretical models for surface forces and adhesion and their measurement using atomic force microscopy
Affiliations
- PMID: 23202925
- PMCID: PMC3497299
- DOI: 10.3390/ijms131012773
Item in Clipboard
Review
Theoretical models for surface forces and adhesion and their measurement using atomic force microscopy
Int J Mol Sci.
.
Abstract
The increasing importance of studies on soft matter and their impact on new technologies, including those associated with nanotechnology, has brought intermolecular and surface forces to the forefront of physics and materials science, for these are the prevailing forces in micro and nanosystems. With experimental methods such as the atomic force spectroscopy (AFS), it is now possible to measure these forces accurately, in addition to providing information on local material properties such as elasticity, hardness and adhesion. This review provides the theoretical and experimental background of afs, adhesion forces, intermolecular interactions and surface forces in air, vacuum and in solution.
Figures

(a) Permanent Dipole-Permanent Dipole or Keesom forces. They exist only between polar molecules, being stronger than London forces for molecules of equivalent size; (b) Permanent Dipole-Induced Dipole or Debye force. It arises from the distortion of the charge cloud induced by a polar molecule nearby, i.e., a non-polar molecule will be temporarily polarized in the vicinity of a polar molecule, and the induced and permanent dipoles will be mutually attracted; (c) Instantaneous Dipole-Induced Dipole or London forces. They result from electrostatic attraction between temporary dipoles and induced dipoles caused by movement of electrons; these are attraction forces that operate between all molecules and among isolated atoms in noble gases. The strength of the forces is related to the number of electrons present and hence to the size of the molecule (or isolated atom); (d) Interactions between molecules–temporary and permanent dipoles.

(a) Scheme for the integration of macroscopic and AFM tip (Reproduced by permission of IOP Publishing Ltd. [80]); (b) SEM image of a sharpened pyramidal tip (Reproduced by permission of Taylor and Francis Ltd. [81].

Attractive force curve for diamond-graphite (kc = 260 Nm−1, Rt = 300 nm) with various theoretical fittings: (a) vdW; (b) surface layer of dielectric material; (c) fixed dipole; and (d) patch charge. The values used for the vdW interactions were Rt = 300 nm and A = 2.5 × 10⁻¹⁹ J. The thickness of the surface layer was 1nm, with a tip radius of 30 μm, A = 2.5 × 10⁻¹⁹ J and ΔA = 0.2. For the fixed dipole curve, the thickness of the dipole layers was 1nm, the dipole moments = 1.4 Debye, the volume density of the dipoles was 3.0 × 1028 m−3 and the tip radius was 300 nm (Reproduced by permission of IOP Publishing Ltd. [94]).

Scheme of two surfaces (i (tip) and i′ (sample)) interacting across of a medium, k, with adsorbed layers j and j′ of thickness t and t′.

Force curve on a wood surface illustrating the points where jump-to-contact (JTC) (approach) and jump-off-contact (JOC) (withdrawal) occur and the maximum values of the attractive force (pull-on force and pull-off force).

Force imaging spectroscopy—Young’s modulus maps of (a) SEBS (10/80/10) and (b) SEBS (21/58/21) (Reprinted with permission from [119] (© 2010, American Chemical Society)).

Map of forces obtained with AFS showing regions of repulsive (conducting islands) and attractive interactions on POEA films in solution (pH = 3).

Geometry employed in the Derjaguin approximation (sphere-sphere), z is the distance between the circular sections, D is the distance between the two bodies (spheres), R is the radial coordinate.

Scheme of the relevant spatial distances in AFM. D is the tip-sample distance, whereas zc is the distance between the sample and the cantilever rest position, and z is the cantilever deflection.

(a) Schematic representation of a liquid drop on a solid surface. Equilibrium is characterized by the three surface tensions acting at the liquid (i): solid, (j): vapor, (k): contact line [211]; (b) The separation of two phases.

Dependence of disjoining pressure on film thickness and type of force involved. Curve (A) corresponds to a repulsive force and is a wetting case. Curve (C) is an attractive force and a non-wetting situation, and curve (B) corresponds to a metastable film (Reproduced by permission of Elsevier [234]).

(a) Histogram illustrating the values of jump-to-contact distance in air (RH ≈ 70%) for sample surfaces of mica, quartz and silicon; (b) Typical force curve enlarged in the attractive region, illustrating the thickness of the liquid film determined by AFS (kc ≈ 0.13 N/m) (Reproduced by permission of Taylor and Francis Ltd. [29]).

Liquid bridges between two surfaces (A and B). The equilibrium state of a liquid bridge is determined by thermodynamics. At equilibrium, the mean curvature of the liquid vapor interface of a bridge must equal the Kelvin radius rk. For wide necks and small θ, d >> r so that r ≈ rk, as drawn; (C–E) Transitions between the equilibrium states A and B usually occur via nonequilibrium processes. For example, because of the vdW force on approach or a Rayleigh instability on separation, fast mechanical instabilities may trigger bridge coalescence (C→D) or snapping (D→E). In such processes, the meniscus curvature is not determined by the Kelvin equation [245].

Schematic view of a water meniscus between a sphere with radius R and a plate (Reproduced by permission of Taylor and Francis Ltd. [29]).

Schematic representation of the electric double layer (EDL). Overall model of the double-layer showing solvent molecules, counterions and specifically adsorbed co-ions.

Schematic DLVO plots showing how the attractive vdW and repulsive electrostatic double-layer forces together determine the total interaction potential between two charged surfaces in aqueous electrolyte solutions at different surface charge densities σ or potentials Ψo (Reproduced by permission of Elsevier [301]).

Forces measured between an α-alumina sphere (O) or silica sphere (Δ) and a flat Teflon AFTM surface in cyclohexane. The separation distance is in arbitrary units and the distance between the tick marks is 2 nm (Reproduced by permission of Elsevier [307]).

Representative deflection vs. piezo extension curves for a Si3N4 tip interacting with a mica sample across various media. In each case, the Hamaker constant was calculated from the fitting parameter: (a) Attractive interaction in ethanol (β = 44.9 Å); (b) small repulsive interaction in 1-bromonaphthalene (β = −22.2 Å); and (c) repulsive interaction in 1-methylnaphthalene (β = −56.9 Å) (Reproduced by permission of American Institute of Physics [114]).
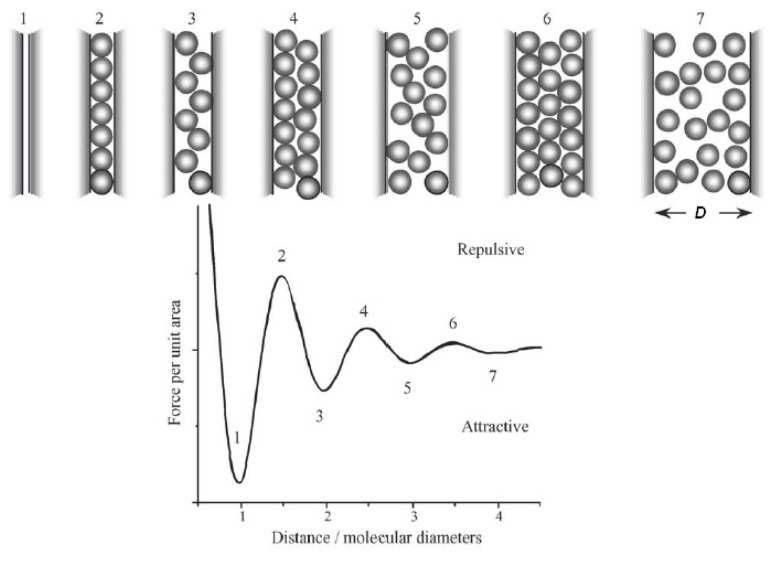
Schematic structure of a simple liquid confined between two parallel walls. The order changes drastically depending on distance, which results in an oscillatory force (adapted from Butt et al. and reproduced by permission of Elsevier [98]).

Schematic picture for the origin of hydration forces according to the model of Paunov et al. (Reproduced by permission of Elsevier [335]).

(a) Molecules or parts of molecules that have low or no affinity for water are called hydrophobic. These are usually composed of hydrocarbons that lack O or N or other polar groups and therefore cannot hydrogen bond or interact easily with water. The water molecules adjacent to hydrophobic domains form ice-like cages that surround the hydrophobic region [379]; (b) Schematic representation of the long-range attraction between hydrophobes initiated by the domains of polarized water (i) and by induced dipoles on the surface of the hydrophobic solutes (ii) (Reproduced by permission of Elsevier [380]).

(a) Molecules or parts of molecules that have low or no affinity for water are called hydrophobic. These are usually composed of hydrocarbons that lack O or N or other polar groups and therefore cannot hydrogen bond or interact easily with water. The water molecules adjacent to hydrophobic domains form ice-like cages that surround the hydrophobic region [379]; (b) Schematic representation of the long-range attraction between hydrophobes initiated by the domains of polarized water (i) and by induced dipoles on the surface of the hydrophobic solutes (ii) (Reproduced by permission of Elsevier [380]).

Interaction between hydrophobic surfaces (Reproduced by permission of Elsevier [387].
References
-
- Burnham N.A., Kulik A.J. Surface Forces and Adhesion. In: Bhushan B., editor. Handbook of Micro/Nanotribology. CRC Press, LLC; Boca Raton, FL, USA: 1999.
-
- Myers D. Surfaces, Interfaces, and Colloids: Principles and Applications. 2nd ed. Wiley-VCH; New York, NY, USA: 1999. p. 501.
-
- Varandas A.J.C., Brandao J. A simple semi-empirical approach to the intermolecular potential of vanderwaals systems.1. Isotropic interactions—Application to the lowest triplet-state of the alkali dimers. Mol. Phys. 1982;45:857–875.
-
- Van der Waals J.D. Thermodynamische Theorie der Capillariteit in de Onderstelling van Continue Dichtheidsverandering. Vol. 1. Verhandel Konink Akad Weten; Amsterdam, The Netherlands: 1893. p. 56.
-
- Kitchener J.A., Prosser A.P. Direct measurement of the long-range van der waals forces. Proc. R. Soc. A. 1957;242:403–409.
Publication types
MeSH terms
Substances
LinkOut - more resources
Full Text Sources
Other Literature Sources
