

Impairment of TRPC1-STIM1 channel assembly and AQP5 translocation compromise agonist-stimulated fluid secretion in mice lacking caveolin1
- PMID: 23203809
- PMCID: PMC3613184
- DOI: 10.1242/jcs.118943
Impairment of TRPC1-STIM1 channel assembly and AQP5 translocation compromise agonist-stimulated fluid secretion in mice lacking caveolin1
Abstract
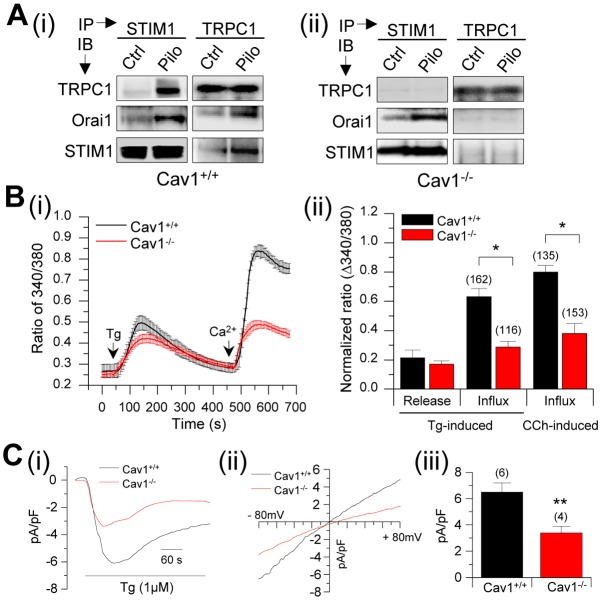
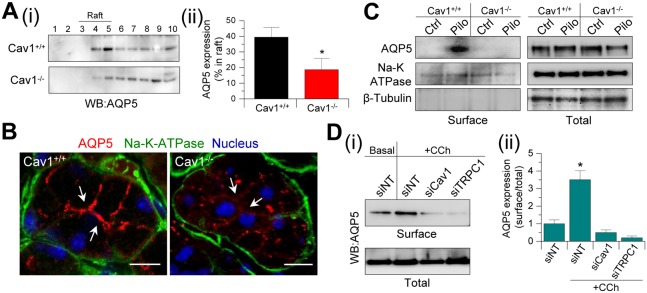
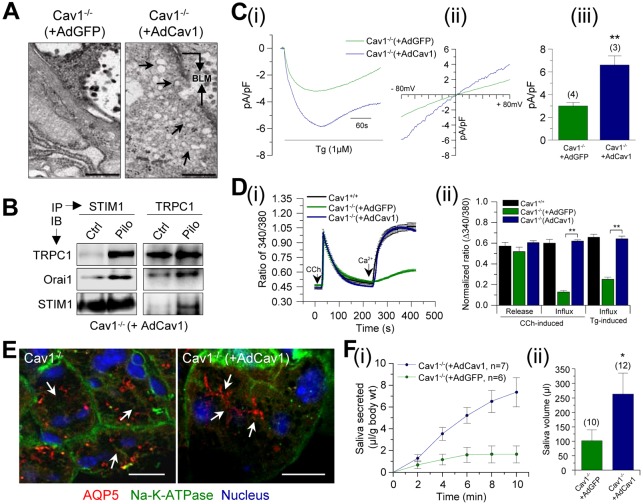
Neurotransmitter regulation of salivary fluid secretion is mediated by activation of Ca(2+) influx. The Ca(2+)-permeable transient receptor potential canonical 1 (TRPC1) channel is crucial for fluid secretion. However, the mechanism(s) involved in channel assembly and regulation are not completely understood. We report that Caveolin1 (Cav1) is essential for the assembly of functional TRPC1 channels in salivary glands (SG) in vivo and thus regulates fluid secretion. In Cav1(-/-) mouse SG, agonist-stimulated Ca(2+) entry and fluid secretion are significantly reduced. Microdomain localization of TRPC1 and interaction with its regulatory protein, STIM1, are disrupted in Cav1(-/-) SG acinar cells, whereas Orai1-STIM1 interaction is not affected. Furthermore, localization of aquaporin 5 (AQP5), but not that of inositol (1,4,5)-trisphosphate receptor 3 or Ca(2+)-activated K(+) channel (IK) in the apical region of acinar cell was altered in Cav1(-/-) SG. In addition, agonist-stimulated increase in surface expression of AQP5 required Ca(2+) influx via TRPC1 channels and was inhibited in Cav1(-/-) SG. Importantly, adenovirus-mediated expression of Cav1 in Cav1(-/-) SG restored interaction of STIM1 with TRPC1 and channel activation, apical targeting and regulated trafficking of AQP5, and neurotransmitter stimulated fluid-secretion. Together these findings demonstrate that, by directing cellular localization of TRPC1 and AQP5 channels and by selectively regulating the functional assembly TRPC1-STIM1 channels, Cav1 is a crucial determinant of SG fluid secretion.
Figures


Similar articles
-
Activation of TRPC1 by STIM1 in ER-PM microdomains involves release of the channel from its scaffold caveolin-1.Proc Natl Acad Sci U S A. 2009 Nov 24;106(47):20087-92. doi: 10.1073/pnas.0905002106. Epub 2009 Nov 6. Proc Natl Acad Sci U S A. 2009. PMID: 19897728 Free PMC article.
-
Molecular determinants mediating gating of Transient Receptor Potential Canonical (TRPC) channels by stromal interaction molecule 1 (STIM1).J Biol Chem. 2014 Mar 7;289(10):6372-6382. doi: 10.1074/jbc.M113.546556. Epub 2014 Jan 24. J Biol Chem. 2014. PMID: 24464579 Free PMC article.
-
Inhibition of L-Type Ca2+ Channels by TRPC1-STIM1 Complex Is Essential for the Protection of Dopaminergic Neurons.J Neurosci. 2017 Mar 22;37(12):3364-3377. doi: 10.1523/JNEUROSCI.3010-16.2017. Epub 2017 Mar 3. J Neurosci. 2017. PMID: 28258168 Free PMC article.
-
Ca²⁺ signaling and regulation of fluid secretion in salivary gland acinar cells.Cell Calcium. 2014 Jun;55(6):297-305. doi: 10.1016/j.ceca.2014.02.009. Epub 2014 Feb 19. Cell Calcium. 2014. PMID: 24646566 Free PMC article. Review.
-
STIM-TRP Pathways and Microdomain Organization: Contribution of TRPC1 in Store-Operated Ca2+ Entry: Impact on Ca2+ Signaling and Cell Function.Adv Exp Med Biol. 2017;993:159-188. doi: 10.1007/978-3-319-57732-6_9. Adv Exp Med Biol. 2017. PMID: 28900914 Review.
Cited by
-
Dynamic interaction of SARAF with STIM1 and Orai1 to modulate store-operated calcium entry.Sci Rep. 2016 Apr 12;6:24452. doi: 10.1038/srep24452. Sci Rep. 2016. PMID: 27068144 Free PMC article.
-
Decrease in alpha-1 antiproteinase antitrypsin is observed in primary Sjogren's syndrome condition.Autoimmunity. 2020 Aug;53(5):270-282. doi: 10.1080/08916934.2020.1768376. Epub 2020 May 25. Autoimmunity. 2020. PMID: 32449389 Free PMC article.
-
Inhibition of store-operated calcium entry in microglia by helminth factors: implications for immune suppression in neurocysticercosis.J Neuroinflammation. 2014 Dec 24;11:210. doi: 10.1186/s12974-014-0210-7. J Neuroinflammation. 2014. PMID: 25539735 Free PMC article.
-
TRPC1-mediated Ca²⁺ entry is essential for the regulation of hypoxia and nutrient depletion-dependent autophagy.Cell Death Dis. 2015 Mar 5;6(3):e1674. doi: 10.1038/cddis.2015.7. Cell Death Dis. 2015. PMID: 25741599 Free PMC article.
-
TRP Channel Involvement in Salivary Glands-Some Good, Some Bad.Cells. 2018 Jul 11;7(7):74. doi: 10.3390/cells7070074. Cells. 2018. PMID: 29997338 Free PMC article. Review.
References
Publication types
MeSH terms
Substances
Grants and funding
LinkOut - more resources
Full Text Sources
Molecular Biology Databases
Miscellaneous
