. 2013 Jan 15;126(Pt 2):613-24.
doi: 10.1242/jcs.116228. Epub 2012 Nov 30.

Regulation of fibroblast growth factor receptor signalling and trafficking by Src and Eps8

Affiliations

Regulation of fibroblast growth factor receptor signalling and trafficking by Src and Eps8

Giulio Auciello et al. J Cell Sci. .

Abstract

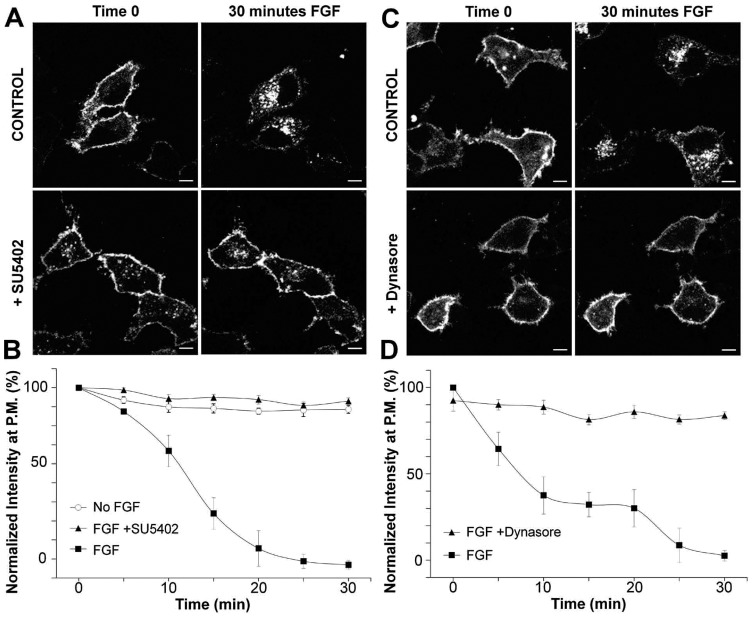
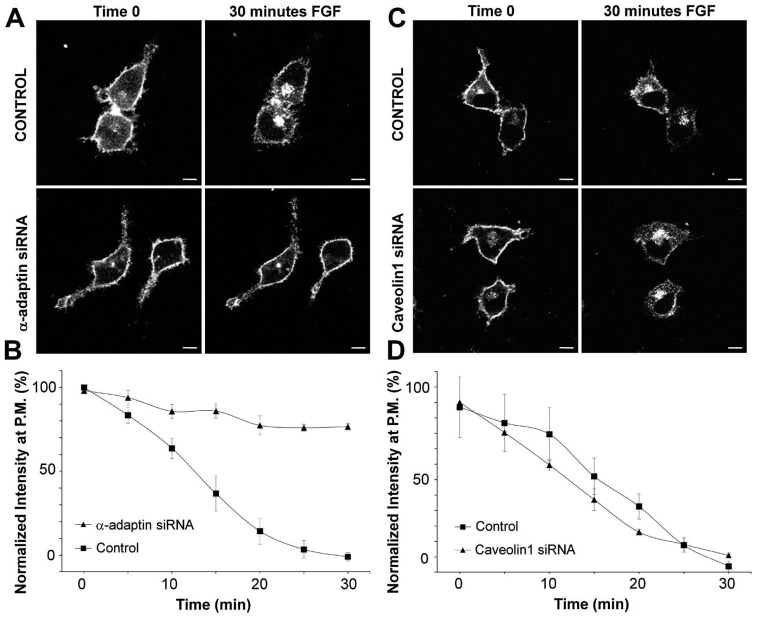
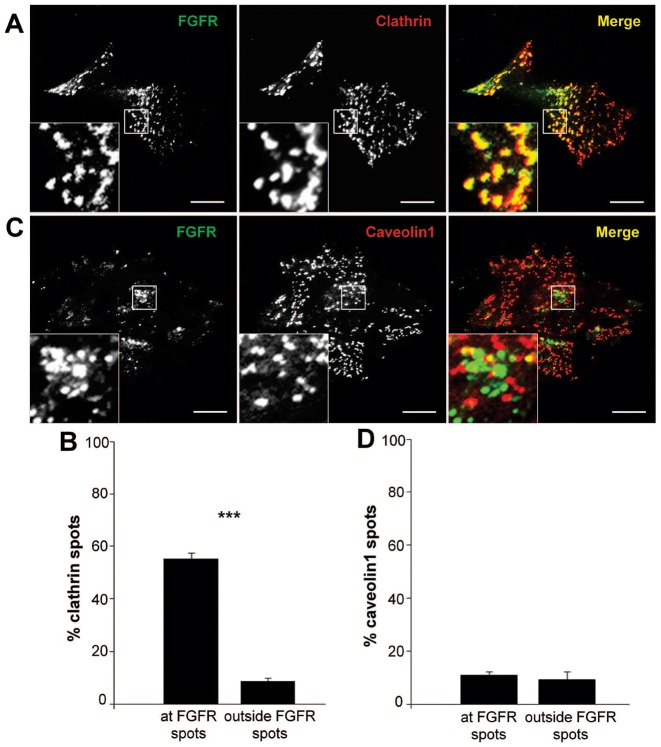
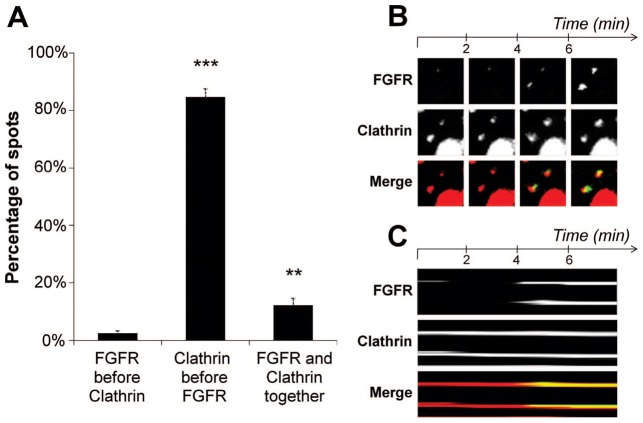
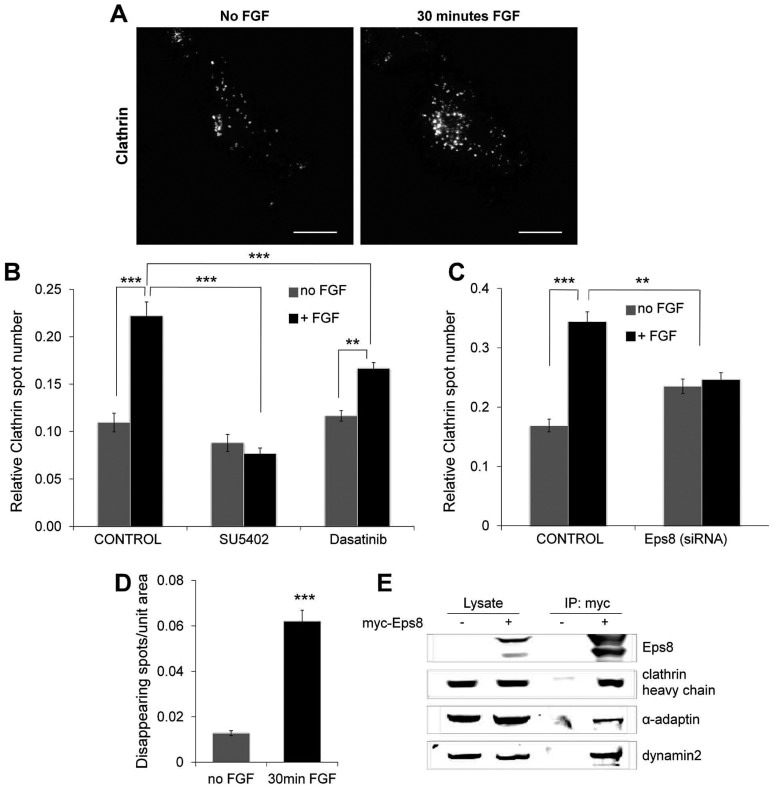
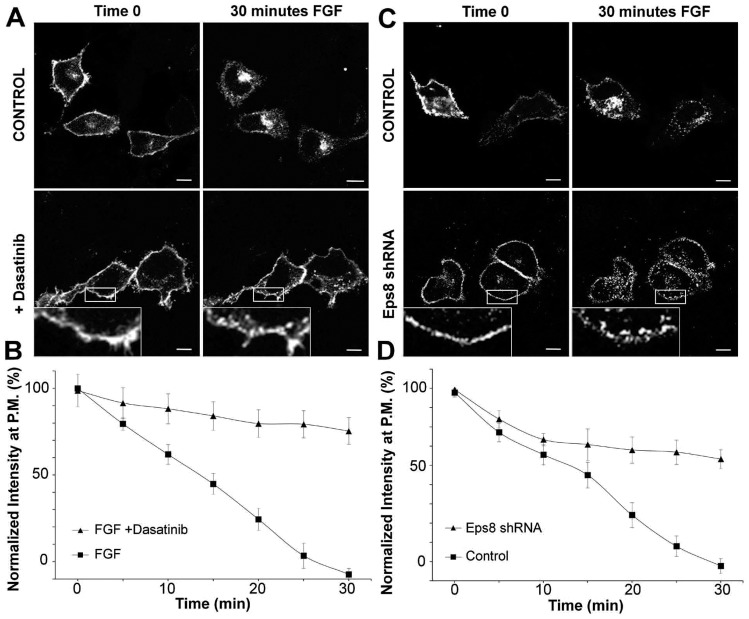
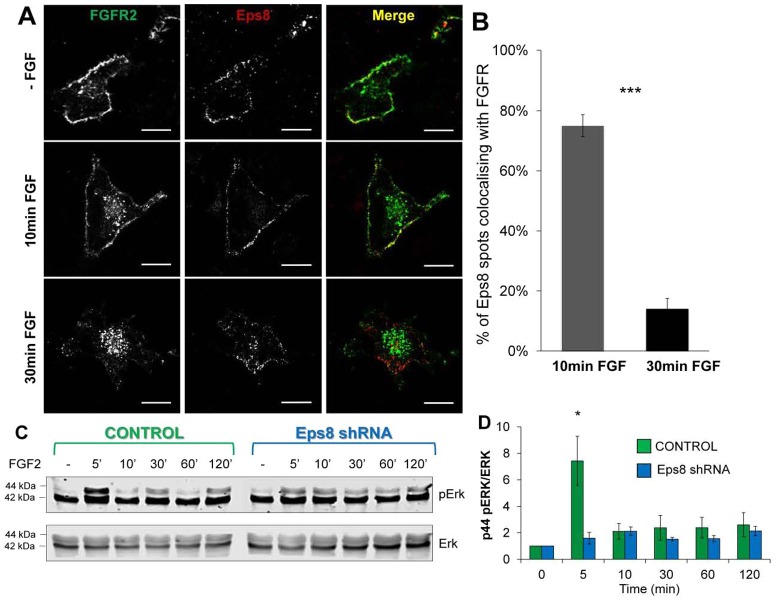
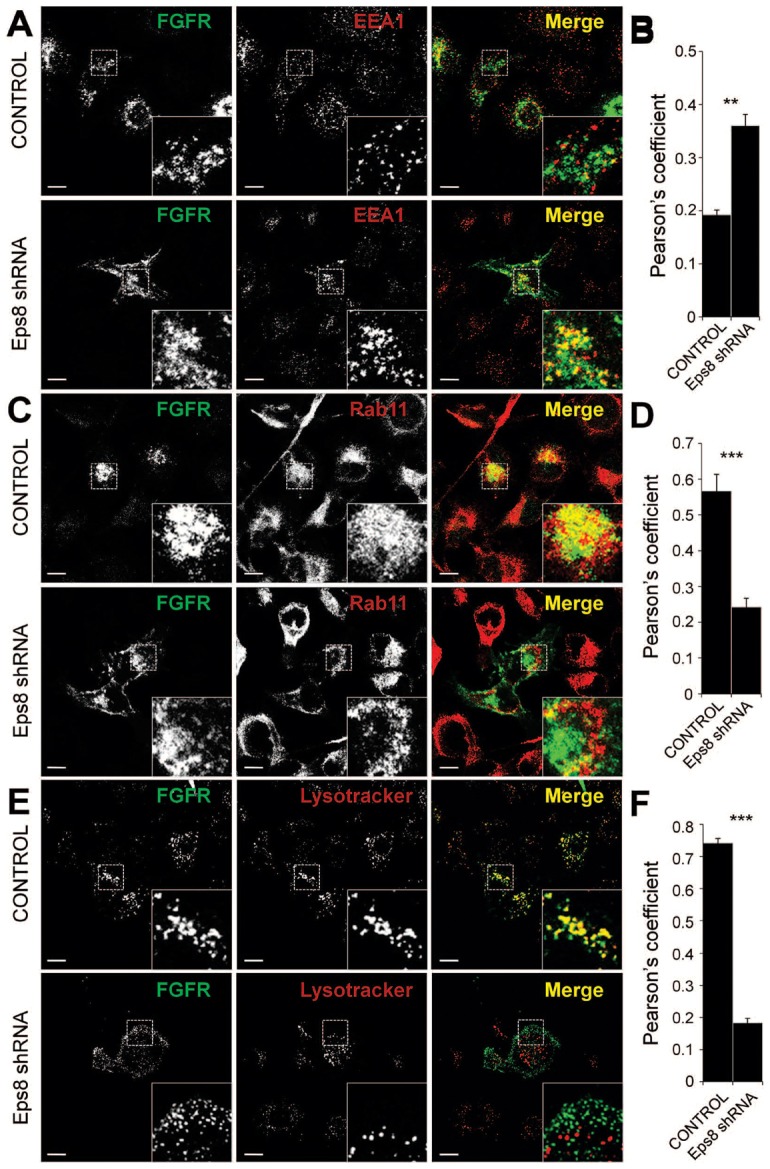
Fibroblast growth factor receptors (FGFRs) mediate a wide spectrum of cellular responses that are crucial for development and wound healing. However, aberrant FGFR activity leads to cancer. Activated growth factor receptors undergo stimulated endocytosis, but can continue to signal along the endocytic pathway. Endocytic trafficking controls the duration and intensity of signalling, and growth factor receptor signalling can lead to modifications of trafficking pathways. We have developed live-cell imaging methods for studying FGFR dynamics to investigate mechanisms that coordinate the interplay between receptor trafficking and signal transduction. Activated FGFR enters the cell following recruitment to pre-formed clathrin-coated pits (CCPs). However, FGFR activation stimulates clathrin-mediated endocytosis; FGF treatment increases the number of CCPs, including those undergoing endocytosis, and this effect is mediated by Src and its phosphorylation target Eps8. Eps8 interacts with the clathrin-mediated endocytosis machinery and depletion of Eps8 inhibits FGFR trafficking and immediate Erk signalling. Once internalized, FGFR passes through peripheral early endosomes en route to recycling and degredative compartments, through an Src- and Eps8-dependent mechanism. Thus Eps8 functions as a key coordinator in the interplay between FGFR signalling and trafficking. This work provides the first detailed mechanistic analysis of growth factor receptor clustering at the cell surface through signal transduction and endocytic trafficking. As we have characterised the Src target Eps8 as a key regulator of FGFR signalling and trafficking, and identified the early endocytic system as the site of Eps8-mediated effects, this work provides novel mechanistic insight into the reciprocal regulation of growth factor receptor signalling and trafficking.


Figures

Fig. 1.
Fig. 1.
Active FGFR is internalized through dynamin-dependent endocytosis. HeLa cells transiently transfected with FGFR2-GFP were incubated for 5 minutes in the presence or absence of SU5402 (A) or for 30 minutes in the presence or absence of Dynasore inhibitor (C) and imaged using confocal live-cell microscopy at 37°C for 30 minutes following stimulation with FGF2 + heparin. The first and the last frames are shown, corresponding to the situations before and after FGF2 treatment, respectively. Scale bars: 5 µm. (B,D) The experiments shown in A and C were performed in many cells and the relative FGFR2–GFP intensity in the PM region of the cells was calculated (as described in the Materials and Methods) for each frame of the time-lapse sequence and plotted as a function of time (means ± s.e.m., n = 14 cells).
Fig. 2.
Fig. 2.
Active FGFR enters cells by clathrin-mediated endocytosis and not through caveolae. HeLa cells were co-transfected with FGFR2–GFP and α-adaptin siRNA (A) or caveolin1 siRNA (C) and confocal live-cell microscopy was performed at 37°C for 30 minutes following stimulation with FGF2 + heparin. Scale bars: 5 µm. (B,D) The experiments shown in A and C were performed in many cells and a quantification of FGFR2–GFP intensity in the PM region of the cells as function of time was performed (means ± s.e.m., n = 10 cells).
Fig. 3.
Fig. 3.
Activated FGFR colocalises with clathrin at the plasma membrane but not with caveolin1. HeLa cells co-transfected with FGFR2–GFP and clathrin–dsRed (A) or caveolin1–mRFP (C) were stimulated with FGF2 + heparin for 15 minutes, then fixed and analysed using dual-colour TIRF microscopy. Higher-magnification images (insets) of selected regions of the cells show overlap of FGFR and clathrin/caveolin1 in yellow. Scale bars: 5 µm. (B,D) Quantification of colocalisation was performed by analysing the overlap of each clathrin or cavolin1 spot with an FGFR one. A control of random colocalisation is also shown (means ± s.e.m., n = 24 cells). *P<0.05; **P<0.01; ***P<0.001.
Fig. 4.
Fig. 4.
Activated FGFR clusters at sites of pre-formed clathrin-coated pits. HeLa cells co-expressing FGFR2–GFP and clathrin–dsRed were imaged using simultaneous two-colour TIRF microscopy at 37°C (1 frame/30 sec) after stimulation with FGF2 + heparin. (B) Selected frames from a time-lapse sequence of two FGFR spots (top) and two clathrin spots (middle), and the merged images (bottom) showing the overlap of the two channels in yellow. (C) The kymographic representation of the spots shown in B reveals that FGFR appears in the TIRF field and colocalises with pre-existing clathrin. (A) Quantification of the percentage of clathrin clusters forming at pre-existing FGFR spots, of FGFR spots recruited at pre-formed clathrin clusters or FGFR and clathrin clustering simultaneously at the plasma membrane (means ± s.e.m., n = 33 cells). *P<0.05; **P<0.01; ***P<0.001.
Fig. 5.
Fig. 5.
FGFR activation promotes clathrin-mediated endocytosis via Src and Eps8. (AC) HeLa cells transiently expressing FGFR2–GFP and clathrin–dsRed and incubated in the presence or absence of SU5402 (5 minutes), Dasatinib inhibitor (30 minutes) or treated with Eps8 siRNA, were analysed using TIRF microscopy before and 30 minutes after stimulation with FGF2 + heparin. (A) Upon FGF stimulation, cells show a significant increase in the number of clathrin spots on the plasma membrane. Scale bars: 5 µm. (B,C) Quantification of the clathrin spots for the different conditions described above reveals that the FGF-dependent increase of clathrin at the plasma membrane is both Src and Eps8 dependent, and requires the full kinase activity of the receptor. (D) HeLa cells expressing FGFR2–GFP and Clathrin–dsRed were imaged using live-cell TIRF microscopy at 37°C for 2 minutes (1 frame/200 msec) before and 30 minutes after stimulation with FGF2 + heparin. Quantification of the clathrin spots disappearing from the TIRF field shows a significant increase in the density of endocytic events upon FGF stimulation (means ± s.e.m., n = 30 cells for each condition in B and C, n = 24 cells in D. *P<0.05; **P<0.01; ***P<0.001. (E) Cellular extracts from HeLa cells transfected with myc–Eps8 (where indicated) were immunoprecipitated with anti-myc, resolved by SDS-PAGE and analysed by immunoblotting for the levels of specified proteins.
Fig. 6.
Fig. 6.
Inhibition of Src kinase activity and silencing of Eps8 impair the trafficking of FGFR. (A) HeLa cells transiently expressing FGFR2–GFP were incubated for 30 minutes in the presence or absence of Dasatinib and imaged by confocal live-cell microscopy at 37°C for 30 minutes following stimulation with FGF2 + heparin. (C) Eps8 knockdown cells (Eps8 shRNA) transiently expressing FGFR2–GFP were stimulation with FGF2 + heparin and imaged as in A. The first and the last frame of the time-lapse sequences are shown in A and C. Scale bars: 5 µm. Higher-magnification images of selected regions from the cells (insets) show an atypical peripheral localisation of FGFR-containing vesicles. (B,D) The quantification of FGFR2–GFP intensity in the PM region of the cells as a function of time shows an impaired trafficking of FGFR in both Src-inhibited and Eps8shRNA cells (means ± s.e.m., n = 16 cells).
Fig. 7.
Fig. 7.
During early stages of trafficking Eps8 colocalises with FGFR and is required for signal transduction through the MAPK cascade. HeLa cells transiently expressing FGFR2–GFP and Eps8–mCherry were either stimulated with FGF2 + heparin for 10 or 30 minutes, or not stimulated, then fixed and analysed using confocal microscopy. (A) During the early stages of activation (10 min FGF), FGFR primarily localises in early endosomal compartments, where it colocalises with Eps8. 30 minutes after FGF addition, FGFR redistributes to the perinuclear region, whereas Eps8 still resides in peripheral compartments, just beneath the plasma membrane. Scale bars: 5 µm. (B) Quantification demonstrates significant colocalisation of FGFR and Eps8 only during early phases of receptor activation, where they both localise in early endocytic compartments (means ± s.e.m., n = 14 cells). (C) Eps8 knockdown and vector control HeLa cells transiently expressing FGFR2–GFP were lysed following stimulation with FGF2 + heparin for the indicated times. Cellular extracts where resolved by SDS-PAGE and analysed by immunoblotting for the levels of the specified proteins. The time course of Erk phosphorylation in response to FGF shows a significant attenuation of p44 ERK signal at early times (5 minutes) in Eps8 knockdown cells. (D) Quantification of p44 pERK levels following FGF stimulation in Eps8 knockdown (blue) and vector control HeLa (green) cells (means ± s.e.m., n = 5 experiments) by densitometric scanning of western blots. *P<0.05; **P<0.01; ***P<0.001.
Fig. 8.
Fig. 8.
Eps8 is required for the trafficking of activated FGFR out of the early endocytic system and into the peri-nuclear recycling and late degradative compartments. Eps8 knockdown and vector control HeLa cells transiently expressing FGFR2–GFP were fixed following stimulation with FGF2 + heparin for 30 minutes, immunostained for EEA1 (A) or Rab11 (C) or treated with LysoTracker Red (E) and analysed by confocal microscopy. Higher-magnification images of selected regions from the cells (insets) show that in Eps8 knockdown cells, where receptor trafficking is impaired, FGFR is retained in the peripheral compartment (EEA1) and prevented from sorting to the peri-nuclear recycling compartment (Rab11) and to the lysosomal degradative compartment (LysoTracker). Scale bars: 5 µm. (B,D,F) Colocalisation between FGFR and EEA1, Rab11 or LysoTracker was quantified in control cells as 0.19±0.02, 0.57±0.04, and 0.74±0.01, respectively, and in Eps8 knockdown cells as 0.36±0.04, 0.24±0.05 and 0.18±0.01, respectively (Pearson's correlation coefficient; means ± s.e.m., n = 18 cells).

References

    1. Ahmed Z., Schüller A. C., Suhling K., Tregidgo C., Ladbury J. E. (2008). Extracellular point mutations in FGFR2 elicit unexpected changes in intracellular signalling. Biochem. J. 413, 37–49 10.1042/BJ20071594 - DOI - PubMed
    1. Axelrod D. (2008). Total internal reflection fluorescence microscopy. Methods Cell Biol. Vol. 89 Correia J J, William Detrich H, III, pp. 169–221 10.1016/S0091-679X(08)00607-9 - DOI - PubMed
    1. Basilico C., Moscatelli D. (1992). The FGF family of growth factors and oncogenes. Adv. Cancer Res. 59, 115–165 10.1016/S0065-230X(08)60305-X - DOI - PubMed
    1. Beenken A., Mohammadi M. (2009). The FGF family: biology, pathophysiology and therapy. Nat. Rev. Drug Discov. 8, 235–253 10.1038/nrd2792 - DOI - PMC - PubMed
    1. Beguinot L., Lyall R. M., Willingham M. C., Pastan I. (1984). Down-regulation of the epidermal growth factor receptor in KB cells is due to receptor internalization and subsequent degradation in lysosomes. Proc. Natl. Acad. Sci. USA 81, 2384–2388 10.1073/pnas.81.8.2384 - DOI - PMC - PubMed

Publication types

MeSH terms