. 2013 Jan;41(Database issue):D70-82.
doi: 10.1093/nar/gks1265. Epub 2012 Nov 30.

Dfam: a database of repetitive DNA based on profile hidden Markov models

Affiliations

Dfam: a database of repetitive DNA based on profile hidden Markov models

Travis J Wheeler et al. Nucleic Acids Res. 2013 Jan.

Abstract

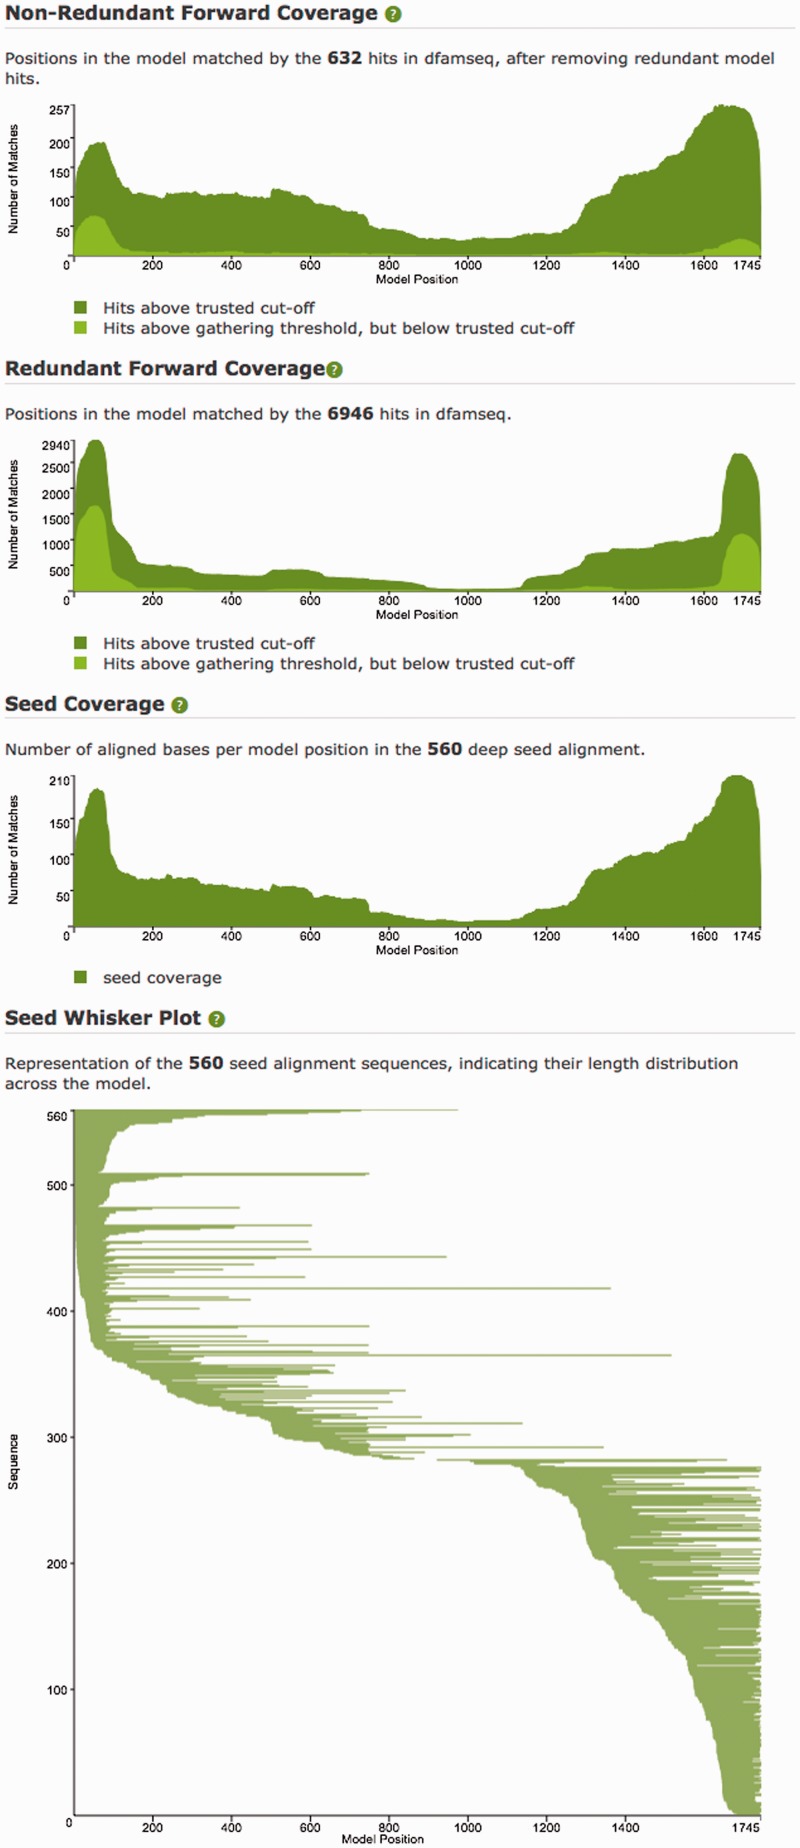
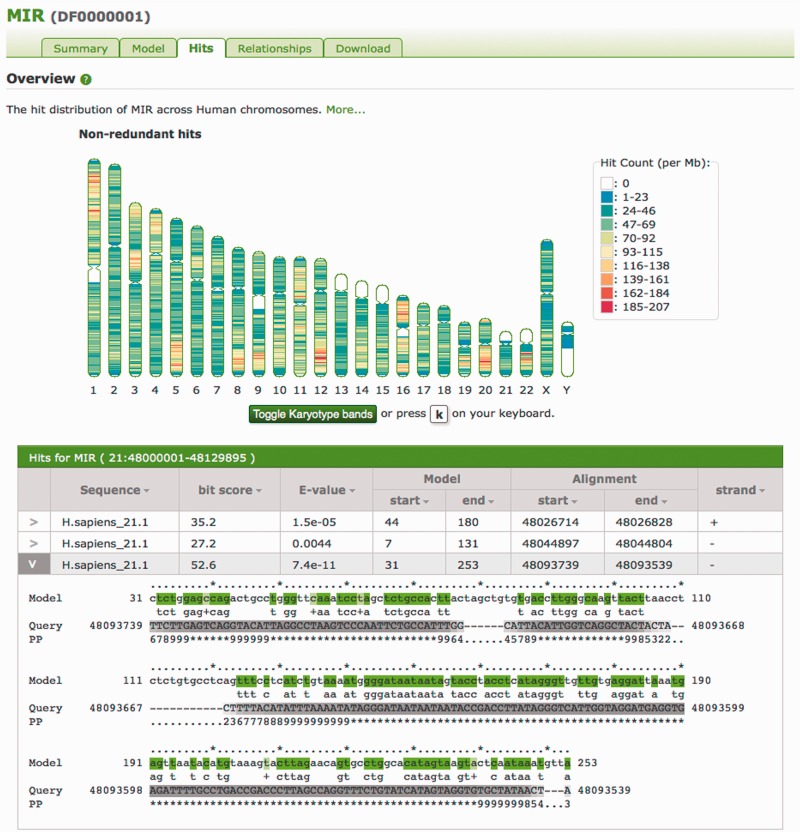
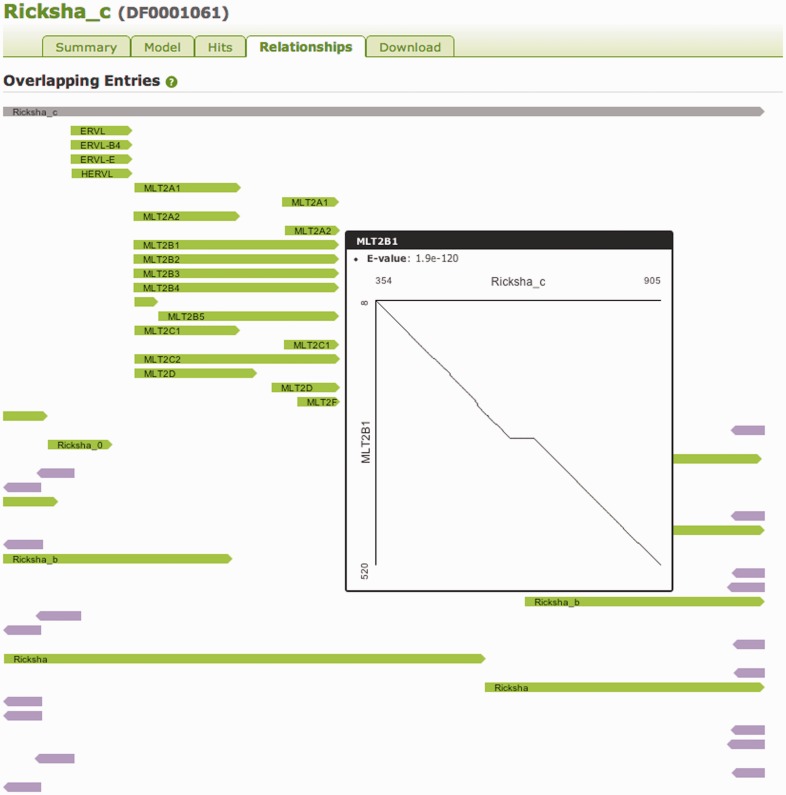
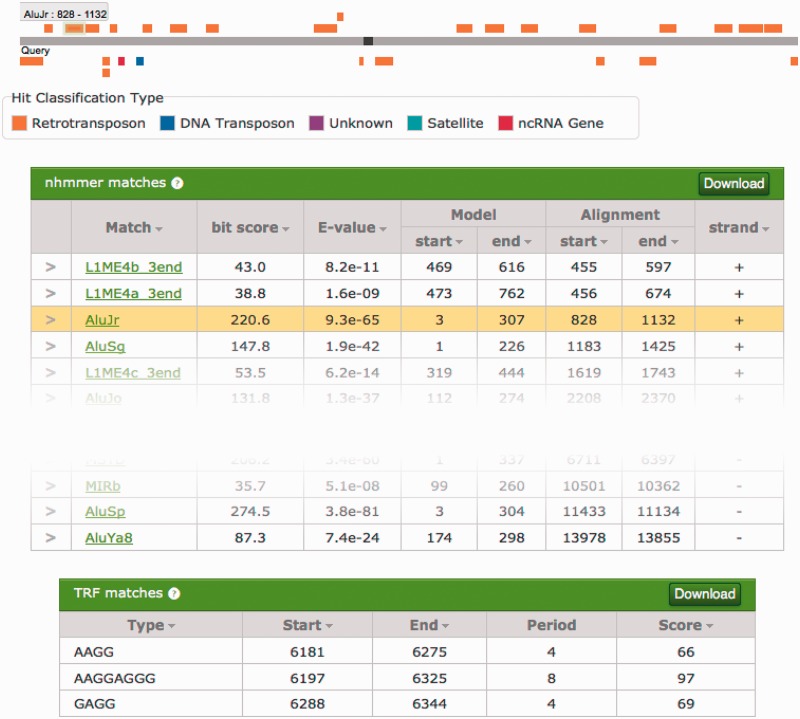
We present a database of repetitive DNA elements, called Dfam (http://dfam.janelia.org). Many genomes contain a large fraction of repetitive DNA, much of which is made up of remnants of transposable elements (TEs). Accurate annotation of TEs enables research into their biology and can shed light on the evolutionary processes that shape genomes. Identification and masking of TEs can also greatly simplify many downstream genome annotation and sequence analysis tasks. The commonly used TE annotation tools RepeatMasker and Censor depend on sequence homology search tools such as cross_match and BLAST variants, as well as Repbase, a collection of known TE families each represented by a single consensus sequence. Dfam contains entries corresponding to all Repbase TE entries for which instances have been found in the human genome. Each Dfam entry is represented by a profile hidden Markov model, built from alignments generated using RepeatMasker and Repbase. When used in conjunction with the hidden Markov model search tool nhmmer, Dfam produces a 2.9% increase in coverage over consensus sequence search methods on a large human benchmark, while maintaining low false discovery rates, and coverage of the full human genome is 54.5%. The website provides a collection of tools and data views to support improved TE curation and annotation efforts. Dfam is also available for download in flat file format or in the form of MySQL table dumps.


Figures

Figure 1.
Figure 1.
Construction of the overextension trap. Bait sequences (a conservative set of bases matched by nhmmer + Dfam and both cross_match and rmblastn with consensus sequences) were placed in inverted order. Inter-bait sequences were concatenated into a long stretch of sequence that was reversed without complementation and divided into equal sized blocks, which were then placed in random order between the bait sequences.
Figure 2.
Figure 2.
Schematic representation of the creation of the multiple sequence alignment and profile HMM for a Dfam entry. The consensus and HMM logo correspond to positions 253–304 of Tigger16a (DF0000028), and highlight the difference between the abilities of HMM and consensus to represent positional residue conservation — a consensus treats all majority rule decisions as equivalent, while a profile HMM enables position-specific scoring based on conservation. In this case, the position labelled with (1) has a slight preference for ‘T’, but will not substantially reward a ‘T’ or penalize any other nucleotide; meanwhile the position labelled with (2) shows a strong preference for ‘T’, and will provide high reward for a matching ‘T’, and a strong penalty for any other nucleotide.
Figure 3.
Figure 3.
(A) Reverse hit coverage of Tigger16a (DF0000028), before model masking. Without model masking, Tigger16a showed 85 reverse hits with E-value <0.25 (the current FDR-based gathering threshold) against dfamseq-rev, with the highest-scoring reverse hit having an E-value of 2.9e-6. All met the definition of false hits. This is a large fraction of the 3753 Tigger16a hits meeting the same threshold against dfamseq. False hits were focused on one part of the model, between positions 300 and 550. (B) HMM logo of the model region responsible for most of the score of false hits. Model positions 344–361 (shown) exhibit properties of a degenerate simple tandem repeat. By masking this short block of the model, only five false hits more significant than E-value of 0.25 remain, with none more significant than 0.007. Masking caused the loss of 145 (of 3753) dfamseq hits meeting the same score threshold.
Figure 4.
Figure 4.
A Dfam entry page from the website. This page shows the summary information for Tigger2a (DF0000838). The tabs at the top allow users to browse the different types of associated information.
Figure 5.
Figure 5.
Plots from the Dfam model page for Kanga1 (DF0000218). The Seed Coverage and Whisker plots show that this seed alignment is made of mostly relatively short fragments, and that the middle section of the model is spanned by only a few instances. The Forward Coverage plot shows a common signal for DNA transposons, with the interior portion of the model covered by fewer instances than the termini, as non-autonomous TEs can suffer various degrees of internal deletion, yet must retain critical terminal features. Many of the 5′ terminal hits fall between the gathering threshold E-value of 15 and trusted cut-off E-value of 0.0002, leading to a terminal light green bulge on the left side of the Non-Redundant Forward coverage plot.
Figure 6.
Figure 6.
The Hits tab for the MIR (DF0000001) entry. This graphic shows the non-uniform distribution of MIRs across the human genome. Large patches of white in the hit distribution ideogram indicate regions with no instances of the model; in this case, these are particularly difficult to sequence heterochromatic regions (represented by N’s in the genome sequence) as can be seen by toggling karyotype bands. Below the karyotype ideogram are given the hits from a region on chromosome 21, with one hit expanded to show the alignment of that hit to the MIR model. In the alignment, the model line presents the consensus sequence for aligned states in the model, coloured according to the match line. The PP line represents the posterior probability, or degree of confidence in each aligned residue (for example, with ‘*’ meaning highest confidence, and low numbers indicating low confidence), with corresponding grey scale colouration of the Query sequence.
Figure 7.
Figure 7.
The Relationship tab for the Ricksha_c (DF0001061) entry. Consensus sequences were produced for all models using the HMMER3 tool hmmemit. These sequences were then searched with all models using nhmmer, with a hit with E-value better than 1e-5 supporting a relationship. Simple glyphs are used to represent the location of different TEs along the along the model, indicating orientation by shape and colour. In this case, the relationships to the ERVL and MLT2 subcomponent elements are represented, as are relationships to other Ricksha models. Placing the mouse over one such glyph raises a dot plot (12) that shows how these elements align to each other.
Figure 8.
Figure 8.
Example of a user-submitted search result. The submitted sequence is represented by the top grey bar, with overlaid black boxes representing TRF matches. Non-redundant Dfam hits to the plus strand are organized above the sequence bar, and hits to the minus strand are organized below the bar. The colour of each Dfam bar depends on the entry type (DNA transposon, RNA retrotransposons, ncRNA, etc.). When a bar is clicked, the row corresponding to that hit is highlighted on the page.

References

    1. Jurka J, Klonowski P, Dagman V, Pelton P. CENSOR—a program for identification and elimination of repetitive elements from DNA sequences. Comput. Chem. 1996;20:119–121. - PubMed
    1. Smit AFA. 1995. Structure and evolution of mammalian interspersed repeats. Ph.D. Thesis. University of Southern California.
    1. Jurka J, Kapitonov VV, Pavlicek A, Klonowski P, Kohany O, Walichiewicz J. Repbase Update, a database of eukaryotic repetitive elements. Cytogent. Genome Res. 2005;110:462–467. - PubMed
    1. Park J, Karplus K, Barrett C, Hughey R, Haussler D, Hubbard T, Chothia C. Sequence comparisons using multiple sequences detect three times as many remote homologues as pairwise methods. J. Mol. Biol. 1998;284:1201–1210. - PubMed
    1. Durbin R, Eddy SR, Krogh A, Mitchison GJ. Biological Sequence Analysis: Probabilistic Models of Proteins and Nucleic Acids. Cambridge, UK: Cambridge University Press; 1998.

Publication types

Substances