. 2013 Mar;23(3):519-29.
doi: 10.1101/gr.142232.112. Epub 2012 Nov 29.

iReckon: simultaneous isoform discovery and abundance estimation from RNA-seq data

Affiliations

iReckon: simultaneous isoform discovery and abundance estimation from RNA-seq data

Aziz M Mezlini et al. Genome Res. 2013 Mar.

Abstract

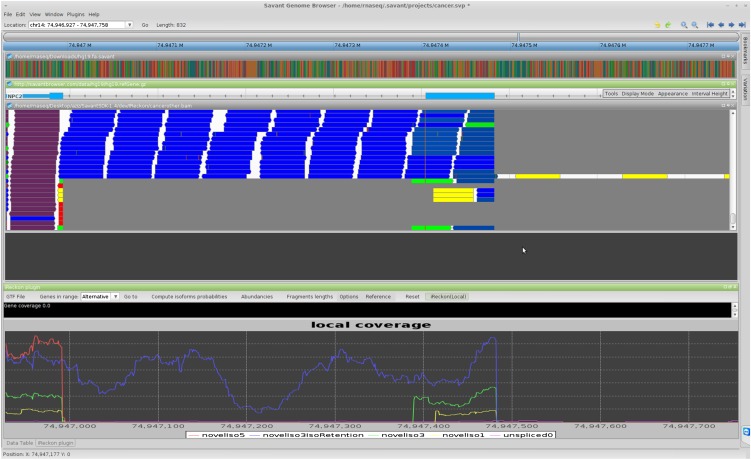
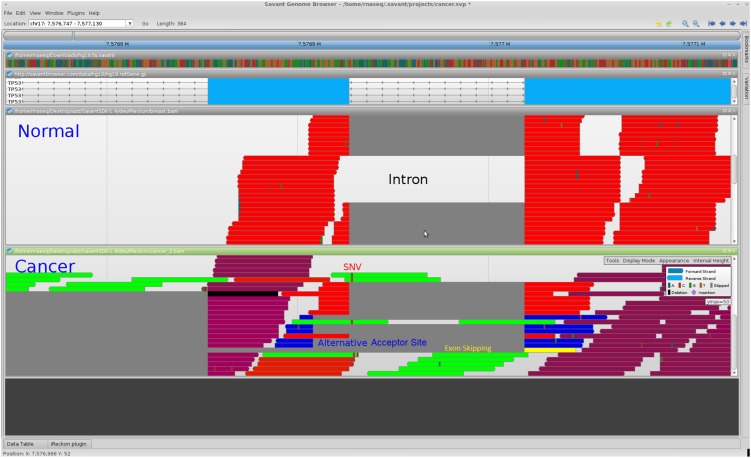
High-throughput RNA sequencing (RNA-seq) promises to revolutionize our understanding of genes and their role in human disease by characterizing the RNA content of tissues and cells. The realization of this promise, however, is conditional on the development of effective computational methods for the identification and quantification of transcripts from incomplete and noisy data. In this article, we introduce iReckon, a method for simultaneous determination of the isoforms and estimation of their abundances. Our probabilistic approach incorporates multiple biological and technical phenomena, including novel isoforms, intron retention, unspliced pre-mRNA, PCR amplification biases, and multimapped reads. iReckon utilizes regularized expectation-maximization to accurately estimate the abundances of known and novel isoforms. Our results on simulated and real data demonstrate a superior ability to discover novel isoforms with a significantly reduced number of false-positive predictions, and our abundance accuracy prediction outmatches that of other state-of-the-art tools. Furthermore, we have applied iReckon to two cancer transcriptome data sets, a triple-negative breast cancer patient sample and the MCF7 breast cancer cell line, and show that iReckon is able to reconstruct the complex splicing changes that were not previously identified. QT-PCR validations of the isoforms detected in the MCF7 cell line confirmed all of iReckon's predictions and also showed strong agreement (r(2) = 0.94) with the predicted abundances.


Figures

Figure 1.
Figure 1.
Screen shot of Savant transcriptome analysis plug-in (RNA-seq Analyzer). (A) Track for the reference genome. (B) Track visualizing aligned reads, with the color representing their isoform of origin probabilities. (C) Known isoform annotation from UCSC. (D) The estimated coverage signal for the various isoforms detected by iReckon. If two RNA-seq data sets are loaded, one can also view differences between abundances of each isoform in the two data sets. Note that the blue isoform has an intron retention event (middle). Because this isoform corresponds to a non-negligible fraction of the overall gene expression level, the failure to identify this event may lead to inaccuracy in quantifying the other isoforms. Additionally, iReckon identifies and quantifies the canonical isoform (in red), the pre-mRNA (in yellow,) and an additional isoform with an alternative donor site (in green). (E) An alternative view of the relative isoform abundances and proportions of reads assigned to each isoform are provided via pie charts. In B and E, black reads are those that could not be assigned to any detected isoforms.
Figure 2.
Figure 2.
Ability of the different methods to discover simulated isoforms. Simulation contains 2533 known isoforms (provided to the methods) and 1006 novel isoforms (811 exon skips, 195 intron retentions). (A) Overall precision and recall for discovering simulated isoforms (known + novel). (B) Recall for isoforms based on level of expression. (Hashed bars) Proportion of known isoforms; (solid bars) novel isoforms. While Cufflinks slightly outperforms iReckon on discovery of known isoforms with high abundance, the results on low-abundance isoforms are reversed, and iReckon outperforms the other methods at identification of all novel isoforms (size of solid sections of bars). (C) Precision and recall for discovery of novel isoforms, as well as recall specific to different types of alternative splicing simulated.
Figure 3.
Figure 3.
Abundance estimation accuracy and isoform detection recall depending on the acceptable error threshold. (A) Abundance estimation accuracy for correctly predicted isoforms. The three plots show the fraction of correctly estimated isoforms depending on the acceptable error rate (isoforms with error above threshold have incorrect abundances) for high-, medium-, and low-abundance isoforms. While performance is best for high-abundance isoforms for all methods, iReckon outperforms other methods for all three categories and regardless of the error threshold. (B) Isoform detection recall depending on the acceptable error rate (isoforms with error above the threshold are considered “not predicted”). iReckon outperforms the other methods, especially for low-abundance isoforms.
Figure 4.
Figure 4.
(A) The precision of the four methods at identifying known genes and their recall for discovering novel (hidden) isoforms from Illumina RNA-seq data. (B) Histogram of the abundances of hidden isoforms (re-)discovered by each method. The x-axis units are log (RPKM).
Figure 5.
Figure 5.
Screen shot of Savant displaying a segment of the NPC2 gene in the MCF7 data set. (Red isoform) Exon skipping; (blue) intron retention; (green and yellow) contain the two alternative donor sites. The purple isoform with low expression is the pre-mRNA.
Figure 6.
Figure 6.
Savant screen shot showing healthy breast (from Illumina BodyMap2) and triple-negative breast cancer RNA-seq data. The third and fourth tracks display the aligned reads from healthy and cancer tissue, respectively, with the colors representing the isoform of origin. (Red isoform) Canonical annotated isoform. Its presence may be due to healthy cells biopsied together with the tumor. (Green isoform) Pre-mRNA (or partially spliced RNA); (blue) contains the alternative acceptor site; (yellow) skips the next exon (to the left since the transcript is on the reverse strand). We can also see the single nucleotide variant (SNV) that disrupted the acceptor site of the intron.

Similar articles

Cited by

References

    1. Berget S 1995. Exon recognition in vertebrate splicing. J Biol Chem 270: 2411. - PubMed
    1. Bohnert R, Rätsch G 2010. rQuant.web: A tool for RNA-seq-based transcript quantitation. Nucleic Acids Res (suppl 2) 38: W348–W351 - PMC - PubMed
    1. Feng J, Li W, Jiang T 2011. Inference of isoforms from short sequence reads. J Comput Biol 18: 305–321 - PMC - PubMed
    1. Fiume M, Williams V, Brook A, Brudno M 2010. Savant: Genome browser for high-throughput sequencing data. Bioinformatics 26: 1938–1944 - PMC - PubMed
    1. Fiume M, Smith E, Brook A, Strbenac D, Turner B, Mezlini A, Robinson M, Wodak S, Brudno M 2012. Savant genome browser 2: Visualization and analysis for population-scale genomics. Nucleic Acids Res 40: W615–W621 - PMC - PubMed

Publication types