. 2013 Feb;79(3):965-73.
doi: 10.1128/AEM.02521-12. Epub 2012 Nov 30.

Evidence for phenotypic plasticity among multihost Campylobacter jejuni and C. coli lineages, obtained using ribosomal multilocus sequence typing and Raman spectroscopy

Affiliations

Evidence for phenotypic plasticity among multihost Campylobacter jejuni and C. coli lineages, obtained using ribosomal multilocus sequence typing and Raman spectroscopy

Daniel S Read et al. Appl Environ Microbiol. 2013 Feb.

Abstract

Closely related bacterial isolates can display divergent phenotypes. This can limit the usefulness of phylogenetic studies for understanding bacterial ecology and evolution. Here, we compare phenotyping based on Raman spectrometric analysis of cellular composition to phylogenetic classification by ribosomal multilocus sequence typing (rMLST) in 108 isolates of the zoonotic pathogens Campylobacter jejuni and C. coli. Automatic relevance determination (ARD) was used to identify informative peaks in the Raman spectra that could be used to distinguish strains in taxonomic and host source groups (species, clade, clonal complex, and isolate source/host). Phenotypic characterization based on Raman spectra showed a degree of agreement with genotypic classification using rMLST, with segregation accuracy between species (83.95%), clade (in C. coli, 98.41%), and, to some extent, clonal complex (86.89% C. jejuni ST-21 and ST-45 complexes) being achieved. This confirmed the utility of Raman spectroscopy for lineage classification and the correlation between genotypic and phenotypic classification. In parallel analysis, relatively distantly related isolates (different clonal complexes) were assigned the correct host origin irrespective of the clonal origin (74.07 to 96.97% accuracy) based upon different Raman peaks. This suggests that the phenotypic characteristics, from which the phenotypic signal is derived, are not fixed by clonal descent but are influenced by the host environment and change as strains move between hosts.


Figures
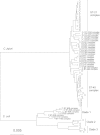
Fig 1
Fig 1
Campylobacter taxonomy based on rMLST. Shown is a neighbor-joining tree reconstructed from concatenated ribosomal protein gene sequences of 85 C. jejuni and C. coli isolates from chicken (circle), cattle (square), wild bird/environment (triangle), pig (inverted triangle), and clinical (diamond) samples. Analysis involved sequences from genomes with at least 51 tagged ribosomal protein genes. Species, clade (C. coli), and clonal complex substructure is evident. The isolate source indicated on the tree is drawn to scale, with branch lengths measured in the number of substitutions per site. Where the isolate belongs to an MLST clonal complex or clade, it is indicated on the tree. The scale bar represents a genetic distance of 0.005.
Fig 2
Fig 2
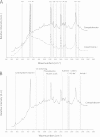
Raman spectra of Campylobacter jejuni and cytochrome c. Shown is a typical Raman spectrum of a Campylobacter jejuni sample smeared on a CaF2 plate and recorded with an excitation wavelength of 532 nm. Smoothing was carried out using a Savitzky-Golay filter. Peaks on the spectrum are shaded to highlight the comparison to equivalent peaks from a spectrum from pure cytochrome c (dotted line) (A) and other Raman peaks that are informative for phenotypic analysis of Campylobacter originating from biomolecules and their bonds (B). A.U., arbitrary unit. (See Table S2 in the supplemental material for full peak identifications and references.)
Fig 3
Fig 3
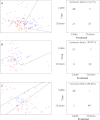
Taxonomic discrimination based on Raman phenotype. Scatter plots of the magnitude of the two most informative peaks for discriminating C. jejuni (circles) and C. coli (crosses) isolates on the basis of species (A), clade (B), and clonal complex (C). Scatterplot axes represent the two most discriminatory wavenumbers from each subset. The solid line indicates the decision boundary calculated from the neural network. In panels A and B, C. coli clades are colored green (clade 1), purple (clade 2), and brown (clade 3). In panel C, C. jejuni isolates originated from the ST-21 clonal complex (circles) and ST-45 clonal complex (squares) based upon sharing alleles at 4 or more loci by MLST. Shown are isolates from human (red), cattle (blue), and chicken (orange). Network confusion matrices for each scatter plot indicate the separation achieved by the model compared to the actual class designation in the neural network trained on all of the informative peaks for each group.
Fig 4
Fig 4
Host origin discrimination based on Raman phenotype. Shown are scatter plots of the magnitude of the two most informative peaks for discriminating ST-21 complex (circles) and ST-45 complex (squares) C. jejuni isolates from cattle (blue) and chicken (orange). Scatterplot axes represent the two most discriminatory wavenumbers from each subset. Plots show (A) ST-21 and ST-45 complex isolates from both hosts, (B) ST-21 complex isolates from both hosts, and (C) ST-45 complex isolates from both hosts. The solid line indicates the decision boundary calculated from the neural network. Network confusion matrices for each scatter plot indicate the separation achieved by the model compared to the actual class designation in the neural network trained on all of the informative peaks for each group.

References

    1. Buzby JC, Roberts T. 1997. Economic costs and trade impacts of microbial foodborne illness. World Health Stat. Q. 50:57–66 - PubMed
    1. Sheppard SK, Colles F, Richardson J, Cody AJ, Elson R, Lawson A, Brick G, Meldrum R, Little CL, Owen RJ, Maiden MC, McCarthy ND. 2010. Host association of Campylobacter genotypes transcends geographic variation. Appl. Environ. Microbiol. 76:5269–5277 - PMC - PubMed
    1. Woolhouse ME, Taylor LH, Haydon DT. 2001. Population biology of multihost pathogens. Science 292:1109–1112 - PubMed
    1. Colles FM, Jones TA, McCarthy ND, Sheppard SK, Cody AJ, Dingle KE, Dawkins MS, Maiden MCJ. 2008. Campylobacter infection of broiler chickens in a free-range environment. Environ. Microbiol. 10:2042–2050 - PMC - PubMed
    1. McCarthy ND, Colles FM, Dingle KE, Bagnall MC, Manning G, Maiden MCJ, Falush D. 2007. Host-associated genetic import in Campylobacter jejuni. Emerg. Infect. Dis. 13:267–272 - PMC - PubMed

Publication types

MeSH terms

LinkOut - more resources