

Treatment Heterogeneity and Individual Qualitative Interaction
- PMID: 23204562
- PMCID: PMC3507541
- DOI: 10.1080/00031305.2012.671724
Treatment Heterogeneity and Individual Qualitative Interaction
Abstract
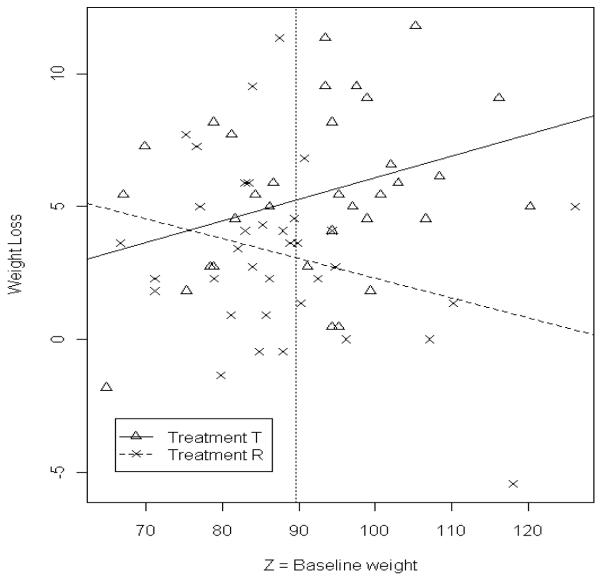
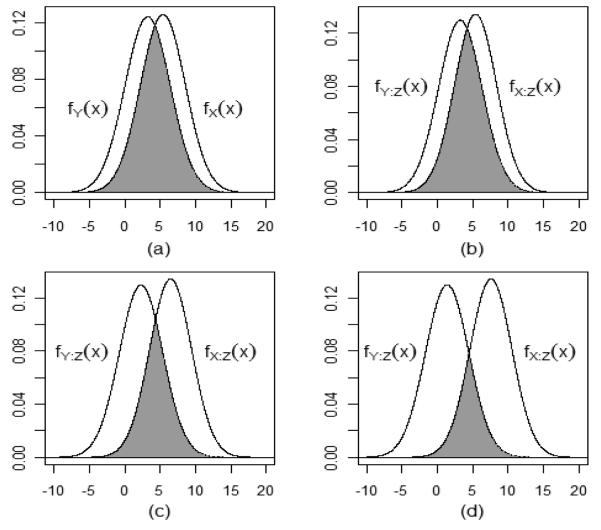
Plausibility of high variability in treatment effects across individuals has been recognized as an important consideration in clinical studies. Surprisingly, little attention has been given to evaluating this variability in design of clinical trials or analyses of resulting data. High variation in a treatment's efficacy or safety across individuals (referred to herein as treatment heterogeneity) may have important consequences because the optimal treatment choice for an individual may be different from that suggested by a study of average effects. We call this an individual qualitative interaction (IQI), borrowing terminology from earlier work - referring to a qualitative interaction (QI) being present when the optimal treatment varies across a"groups" of individuals. At least three techniques have been proposed to investigate treatment heterogeneity: techniques to detect a QI, use of measures such as the density overlap of two outcome variables under different treatments, and use of cross-over designs to observe "individual effects." We elucidate underlying connections among them, their limitations and some assumptions that may be required. We do so under a potential outcomes framework that can add insights to results from usual data analyses and to study design features that improve the capability to more directly assess treatment heterogeneity.
Figures
References
-
- Balaam LN. A Two-period Design with t2 Experimental Units. Biometrics. 1968;24:61–73. - PubMed
-
- Brown BW. The Crossover Experiment for Clinical Trials. Biometrics. 1980;36:69–79. - PubMed
-
- Byar DP, Corle DK. Selecting Optimal Treatment in Clinical Trials Using Covariate Information. Journal of Chronic Diseases. 1977;30:445–459. - PubMed
-
- Darwin C. On the Origin of Species. 5th ed D. Appleton and Company; New York: 1871. p. 26.
-
- Endrenyi L, Tothfalusi L. Subject-by-Formulation Interaction in Determinations of Individual Bioequivalence: Bias and Prevalence. Pharmaceutical Research. 1999;16:186–190. - PubMed
Grants and funding
LinkOut - more resources
Full Text Sources
Miscellaneous