. 2012:2:906.
doi: 10.1038/srep00906. Epub 2012 Nov 30.

Delineation of breast cancer cell hierarchy identifies the subset responsible for dormancy

Affiliations

Delineation of breast cancer cell hierarchy identifies the subset responsible for dormancy

Shyam A Patel et al. Sci Rep. 2012.

Abstract

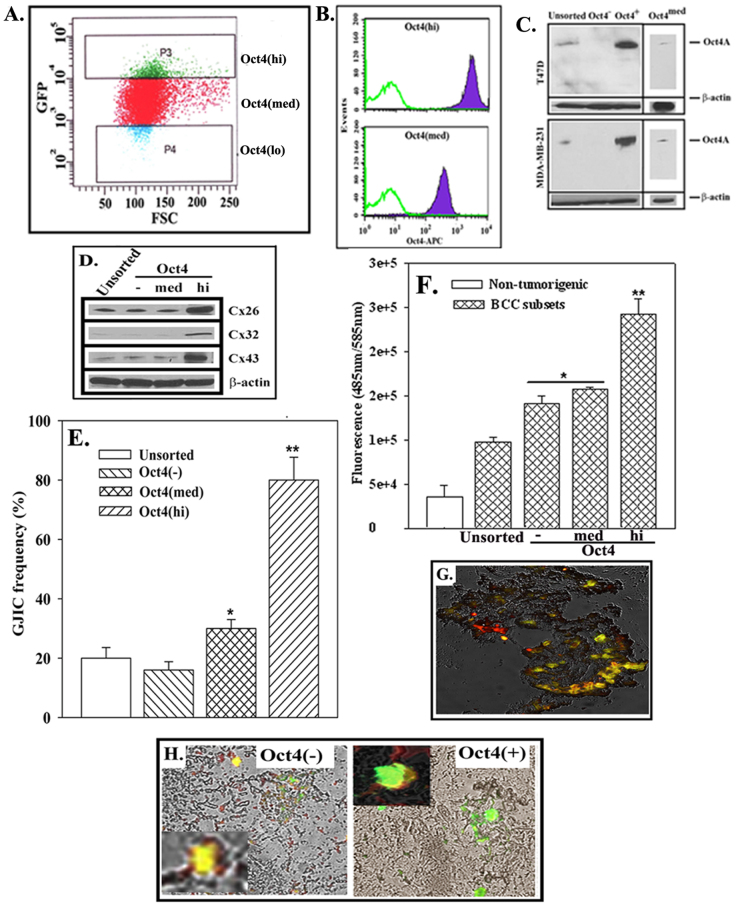
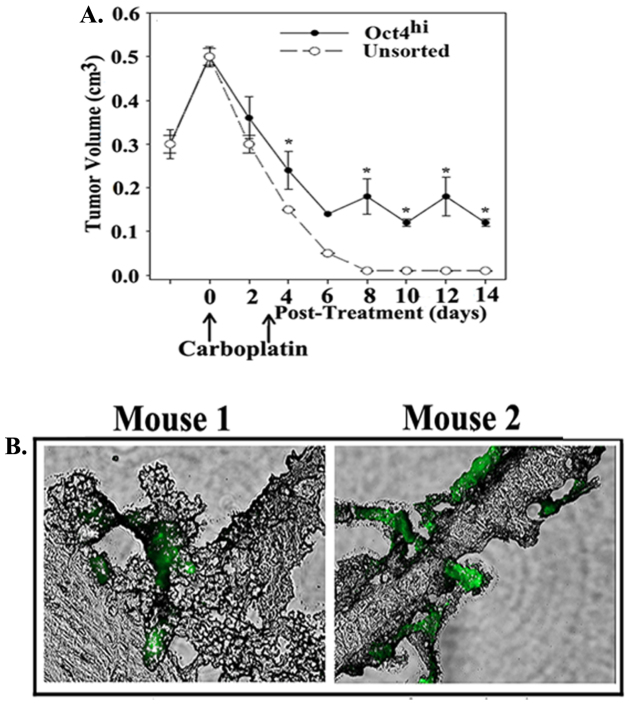
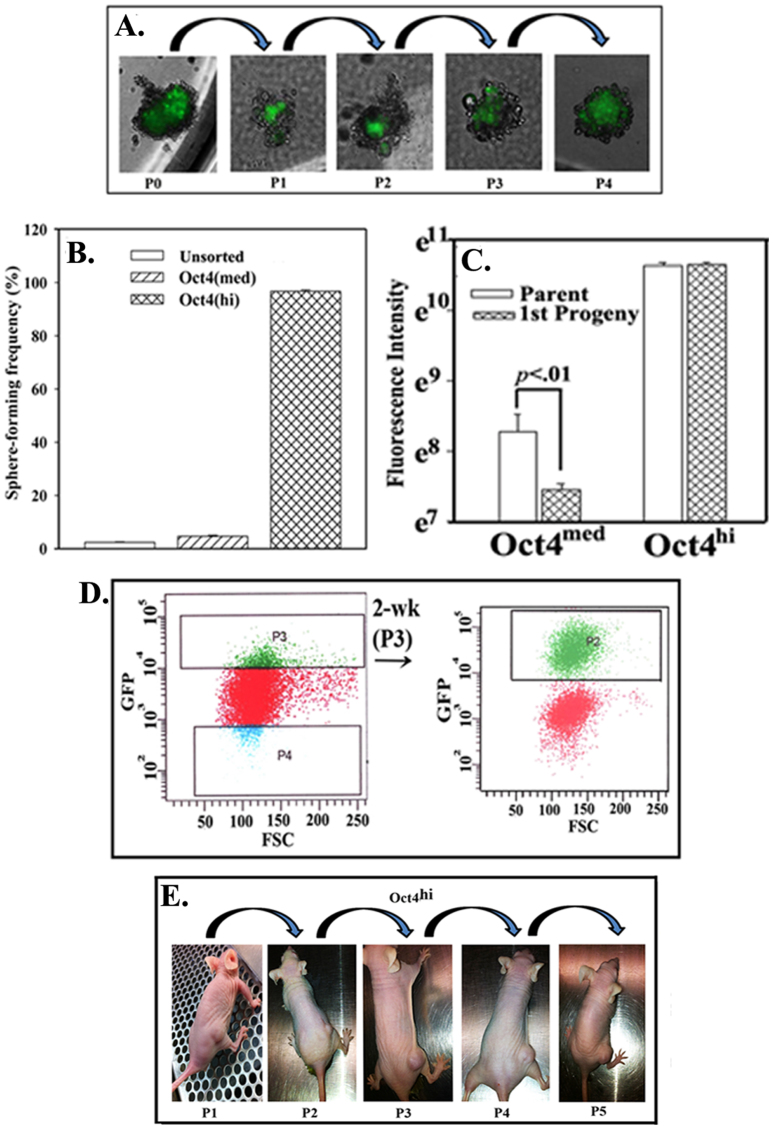
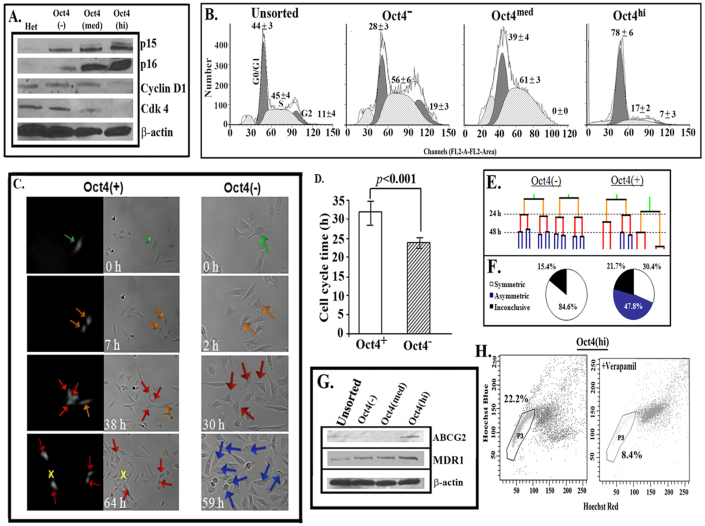
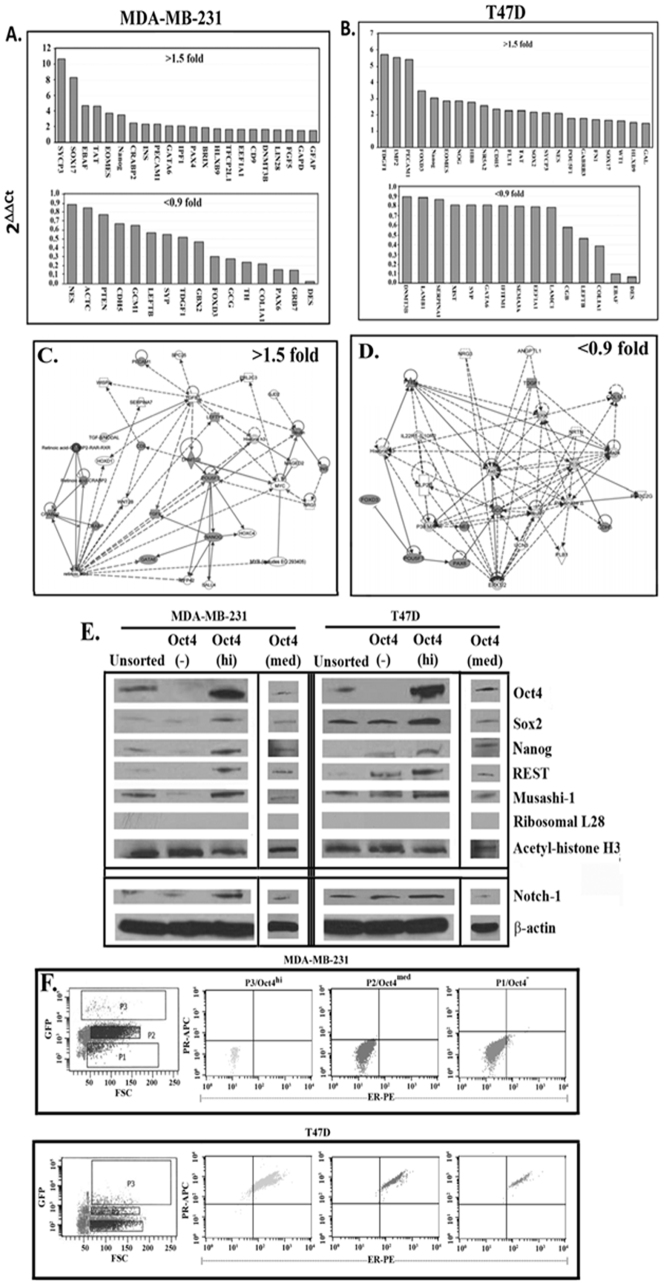
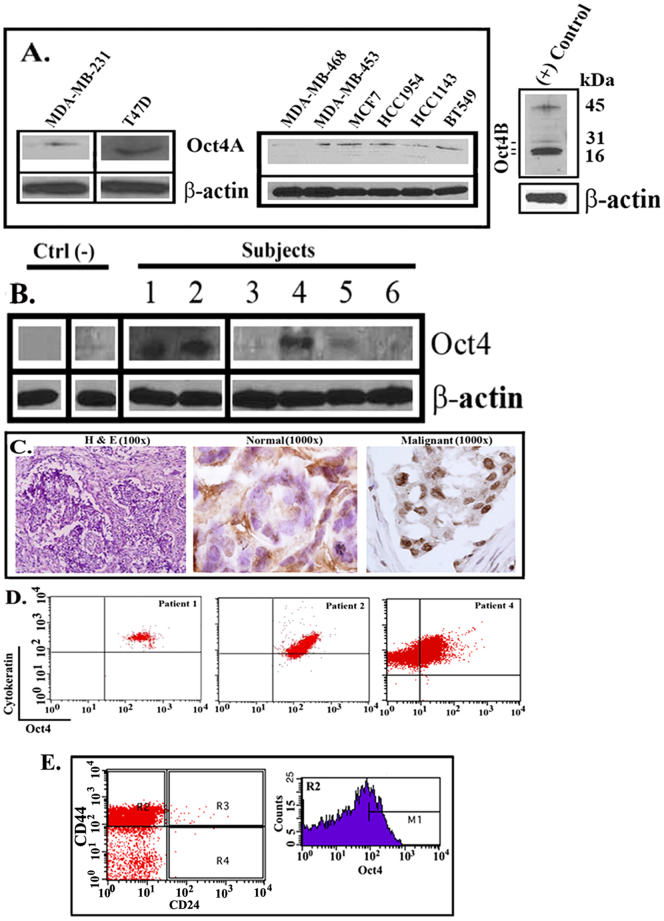
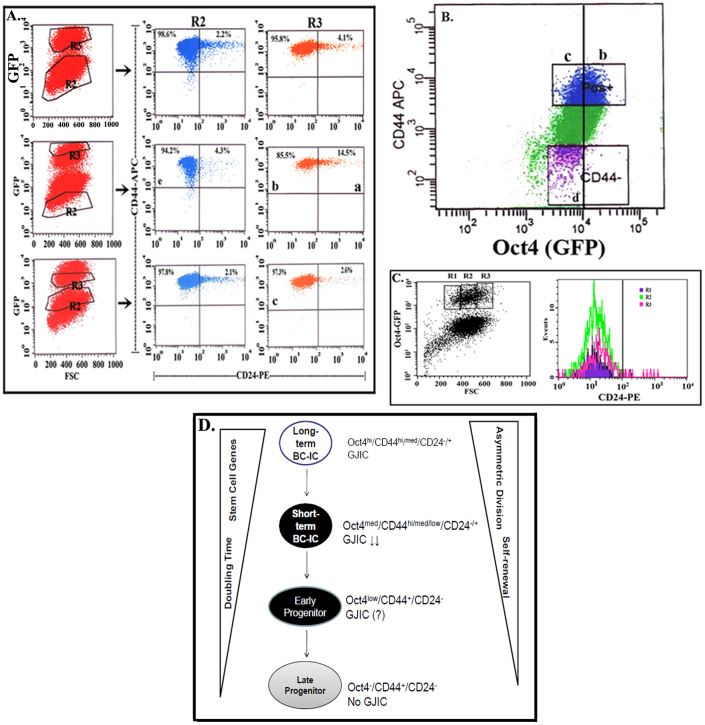
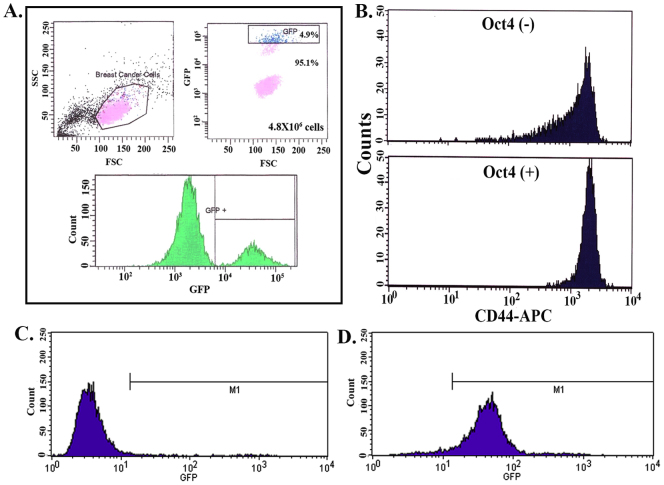
The bone marrow (BM) is a major organ of breast cancer (BC) dormancy and a common source of BC resurgence. Gap junctional intercellular communication (GJIC) between BC cells (BCCs) and BM stroma facilitates dormancy. This study reports on a hierarchy of BCCs with the most immature subset (Oct4(hi)/CD44(hi/med)/CD24(-/+)) demonstrating chemoresistance, dormancy, and stem cell properties: self-renewal, serial passaging ability, cycling quiescence, long doubling time, asymmetric division, high metastatic and invasive capability. In vitro and in vivo studies indicated that this subset was responsible for GJIC with BM stroma. Similar BCCs were detected in the blood of patients despite aggressive treatment and in a patient with a relatively large tumor but no lymph node involvement. In brief, these findings identified a novel BCC subset with stem cell properties, with preference for dormancy and in the circulation of patients. The findings establish a working cellular hierarchy of BCCs based on phenotype and functions.


Figures

Figure 1
Figure 1. GJIC by Oct4hi BCCs.
A) Selection of BCC subsets with stable transfectants of pEGFP1-Oct3/4. The top and bottom 5% GFP intensities were designated Oct4hi and Oct4low, respectively and the middle, Oct4med. B) Intracellular flow cytometry for Oct4 protein in Oct4hi and Oct4med subsets. C) Western blots for Oct4 were performed with extracts from unsorted and sorted BCCs. The same blot is also shown for the Oct4 component of Fig. 5E. D) Western blot (n = 4) for Cxs with membrane extracts of BCC subsets. E) The frequency of GJIC with different BCC subsets are shown, mean±SD, n = 4. F) Invasion of BCC subsets and non-tumorigenic MCF12A through matrigel, mean±SD, n = 4. G) BALB/c mice were injected intravenously with 103 BCCs, stably transfected with pEGFP1-Oct3/4. After 72 h, the endosteal regions of femurs were examined microscopically (100x) for Oct4 (+) BCCs by labeling with cytokeratin-PE+ (red). Yellow indicates the merging of PE (red) with GFP (green). H) CFDA-SE-labeled BCCs were injected intravenously and the cells close to the endosteum were labeled for cytokeratin-PE (red). Representative images are shown for Oct4 and Oct4hi BCCs (100x). **p<0.05 vs. other subset; * p<0.05 vs. unsorted and Oct4 subset.
Figure 2
Figure 2. Chemoresistance of Oct4hi BCCs in vivo.
A) Oct4hi and unsorted BCCs were injected in the dorsal flank of nude BALB/c mice. When the tumor reached ~0.5 cm3 the mice were treated with carboplatin and the timeline changes in tumor volumes are measured. The data are presented as the mean tumor volume±SD, n = 10. * p<0.05 vs. unsorted BCCs. B) Nude BALB/c mice (n = 10) were injected intravenously with 103 unsorted pEGFP or pEGFP1-Oct3/4-transfected MDA-MB-231. After 24 h, the mice were injected intraperitonially at 3-day intervals with carboplatin (50 mg/kg). After 1 wk, the endosteal regions were examined for GFP+ cells.
Figure 3
Figure 3. Self-renewal of Oct4hi BCCs.
A) Serial passages of tumorsphere with 1 Oct4hi cell. B) The frequencies (mean±SD, n = 20) of tumorspheres are shown for unsorted, Oct4hi and Oct4med BCCs. C) The mean±SD (n = 24) GFP intensities are shown for the parental and daughter of Oct4hi and Oct4med BCCs (Fig. S3B). D) Culture of freshly sorted Oct4hi BCCs (left panel, also shown in Fig. 1A) for 2 wks resulted in a heterogeneous population, based on GFP expression (right panel). E) Serial passages of 200 Oct4hi cells were performed in the dorsal flank of nude BALB/c.
Figure 4
Figure 4. Cycling and division patterns of BCC subsets.
A) Western blots for cell cycle proteins were performed with nuclear extracts from unsorted and sorted BCCs. The data are shown for T47D. B) Analyses of cell cycle phase for BCC subsets by flow cytometry, using propidium iodide labeling. The data are shown for MDA-MB-231. C) Bright-field and fluorescence images of divided cells for an Oct4+ (left) and an Oct4 (right) cell by video time-lapse microscopy. The parental cell is shown with a green arrow and progenies of first, second and third divisions, orange, red and blue arrows, respectively. The yellow X represents a non-viable cell. D) Oct4+ and Oct4 BCCs were assessed for cell cycle time using time-lapse imaging; between anaphase of the parental and daughter cells. Data are presented as mean cell cycle±SD, n = 50 cells. E) An Oct4+ and Oct4 cell and the progenies were tracked by time-lapse video microscopy for 68 h. The data are presented as lineages for the two subsets. The parental cells are shown as green vertical lines, and the progenies of the first, second and third cell divisions as orange, red, and blue, respectively. Vertical lines represent the time from 0 to 68 h, and dashed lines indicate 24 and 48 h after the start of real-time imaging. Oct4 cells gave rise to daughters with similar proliferative rates whereas Oct4+ cells gave rise to both fast-dividing and slow-dividing daughters. F) The quantitative data of tracking multiple cell divisions from initial single cells over a 68 h time period show the relative frequency of asymmetric and symmetric cell divisions derived from single Oct4+ and Oct4 cells. G) Western blots for ABCG2 and MDR1. H) Oct4hi MDA-MB-231 and T47D were studied for the retention of Hoechst 33342 with or without verapamil. The analyses used Hoechst Blue and Red filters n = 5). Marked subset shows dye efflux of the SP cells.
Figure 5
Figure 5. Relative gene expressions in BCC subsets.
A & B) Taqman Stem Cell Array compared gene expression in Oct4+ and Oct4 MDA-MB-231 (A) and T47D (B). C & D) The output values were normalized to the internal control and then presented as ΔΔCt of Oct4hi/Oct4. The genes showing >1.5 (C) and <0.9 fold (D) differences were analyzed with Ingenuity Pathway Program. E) BCC subsets were studied for stem cell-associated proteins by western blots with nuclear extracts. Notch-1 was analyzed with cytoplasmic extracts. Blots for acetyl-histone H3 and ribosomal protein L28 verified the purity of the compartmentalized extracts. F) Flow cytometry was performed for progesterone (PR) and estrogen (ER) receptors in BCC subsets.
Figure 6
Figure 6. Oct4 expression in BCCs.
A & B) Western blots were performed with whole cell extracts from BCC lines (A) and primary breast tissues: malignant and surrounding (Ctrl) areas (B). The antibody detected all isoforms of Oct4, as shown in the right panel (A). C) Immunohistochemistry with malignant and surrounding normal tissues (Table S1) were stained with hematoxylin and eosin (H&E) (100x) or labeled with anti-Oct4, diaminobenzidine (DAB) and HRP (1000x). D) Flow cytometry with peripheral blood mononuclear cells from BC patients for cytokeratin (PE) and Oct4 (FITC). Shown are the cells within the threshold of PE emission (cytokeratin+) that co-expressed Oct4. The analyses represent 9 subjects (Table S2). E) Cytokeratin(+) cells in the blood of three patients (one Stage 1 and two Stage 3) were analyzed for CD44 and CD24 and the CD44+/CD24 cells (R2) were further studied for Oct4.
Figure 7
Figure 7. Phenotypic analyses of BCCs and hierarchical representation of BCC subsets.
A) pEGFP1-Oct3/4-transfectants were analyzed for CD44 and CD24 by flow cytometry. B) CD24+ cells were depleted from pEGFP1-Oct3/4- transfectants and then analyzed for CD44 and Oct4 (GFP). C) The top GFP+ cells (Oct4hi) were further analyzed, based on size (R1–R3), for CD24. D) A working hierarchy, based on function and phenotype.
Figure 8
Figure 8. Phenotype of in vivo BCC subsets.
A) Suspension cells from passage 3 tumors in nude mice were analyzed by flow cytometry for subsets, based on GFP expression. B) Nude BALB/c injected with Oct4hi and Oct4 BCCs subcutaneously. The cells were CD44+ as shown in Fig. 7B. After one (Oct4) and two (Oct4hi) weeks, the tumors were removed and then reanalyzed for CD44 expression by flow cytometry. C & D) Nude BALB/c mice were injected intravenously with Oct4 (C) and Oct4+ (D) BCCs. After five days, cytokeratin(+) cells were selected in the femurs and then studied for Oct4 expression.

Similar articles

Cited by

References

    1. Kakarala M. & Wicha M. S. Implications of the cancer stem-cell hypothesis for breast cancer prevention and therapy. J Clin Oncol 26, 2813–2820 (2008). - PMC - PubMed
    1. Corcoran K. E. et al. Mesenchymal stem cells in early entry of breast cancer into bone marrow. PLoS One 3, e2563 (2008). - PMC - PubMed
    1. Rao G. et al. Facilitating Role of Preprotachykinin-I Gene in the Integration of Breast Cancer Cells within the Stromal Compartment of the Bone Marrow. Cancer Res 64, 2874–2881 (2004). - PubMed
    1. Bodenstine T. M. et al. Homotypic Gap Junctional Communication Associated with Metastasis Suppression Increases with PKA Activity and Is Unaffected by PI3K Inhibition. Cancer Res 70, 10002–10011 (2010). - PMC - PubMed
    1. King T. J., Fukushima L. H., Yasui Y., Lampe P. D. & Bertram J. S. Inducible expression of the gap junction protein connexin43 decreases the neoplastic potential of HT-1080 human fibrosarcoma cells in vitro and in vivo. Mol Carcinog 35, 29–41 (2002). - PubMed

Publication types

MeSH terms