

The influence of the arid Andean high plateau on the phylogeography and population genetics of guanaco (Lama guanicoe) in South America
- PMID: 23206254
- PMCID: PMC3549358
- DOI: 10.1111/mec.12111
The influence of the arid Andean high plateau on the phylogeography and population genetics of guanaco (Lama guanicoe) in South America
Abstract
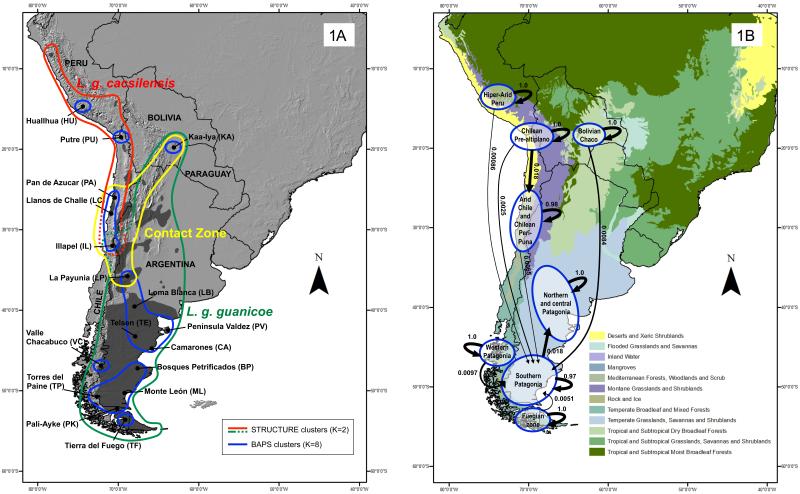
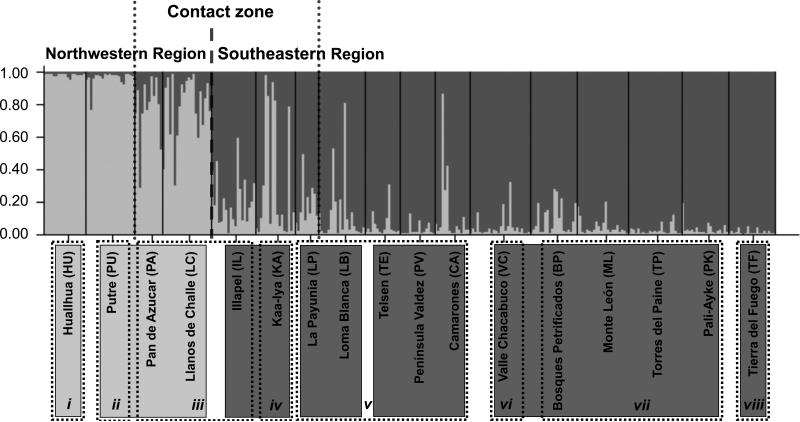
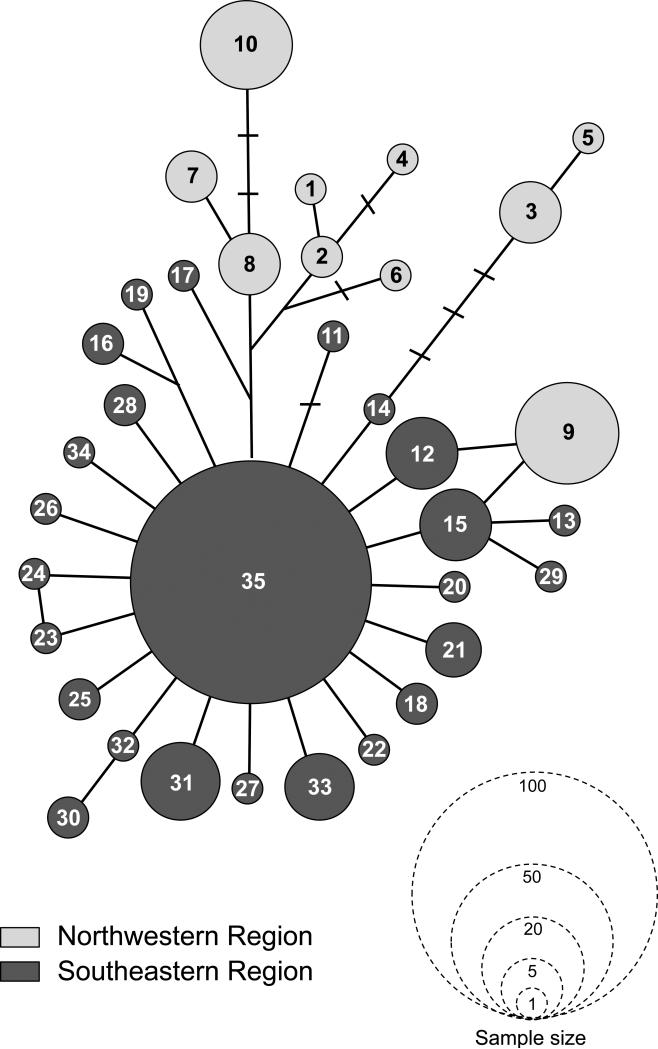
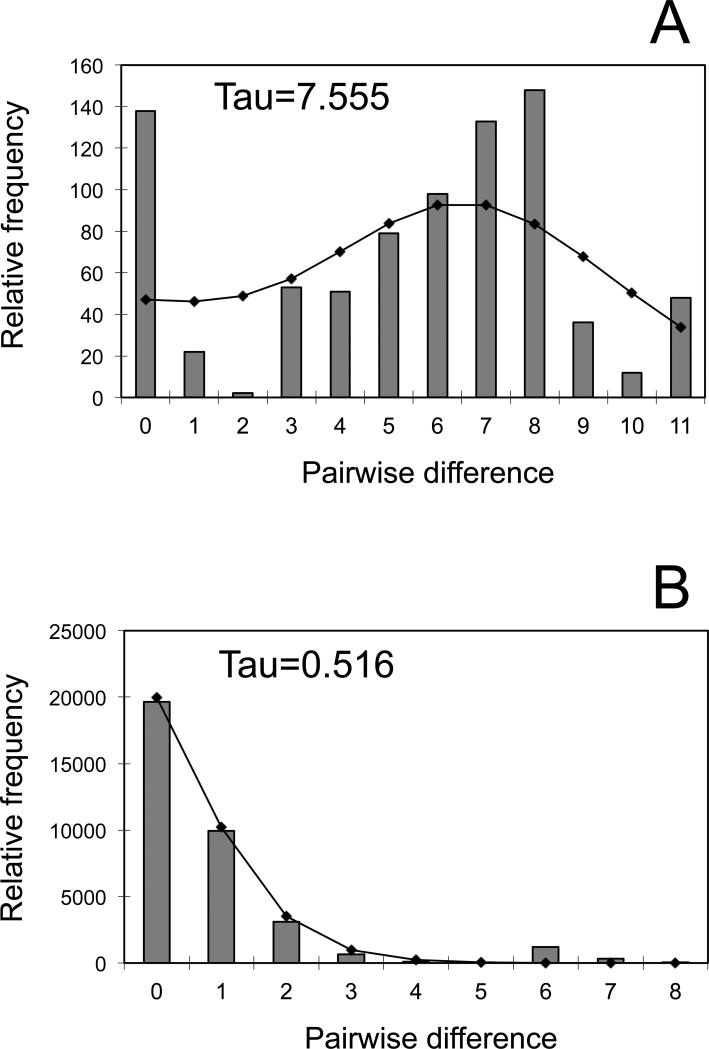
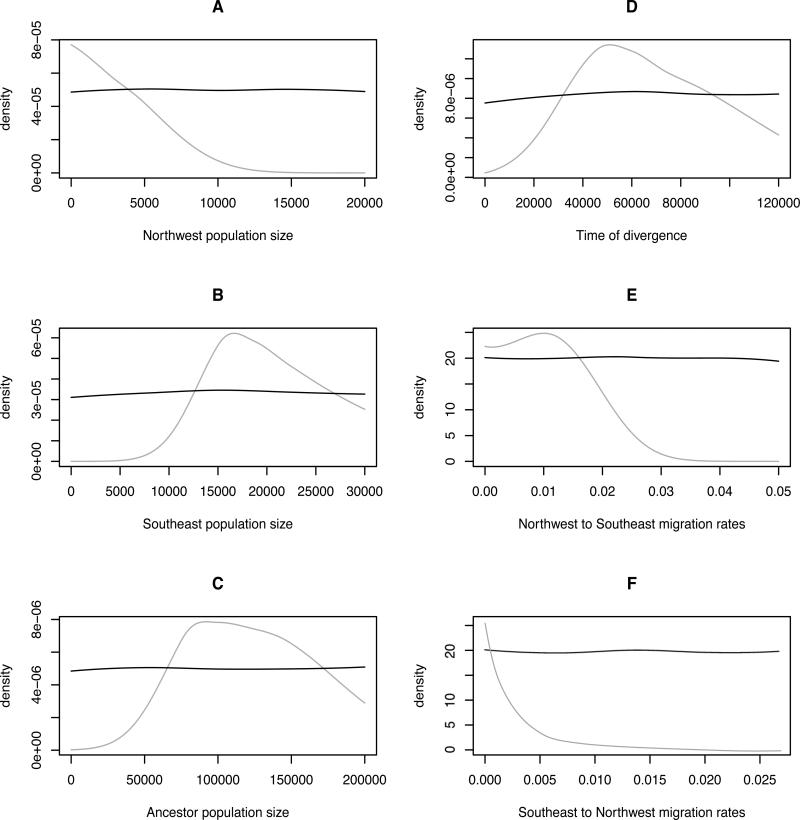
A comprehensive study of the phylogeography and population genetics of the largest wild artiodactyl in the arid and cold-temperate South American environments, the guanaco (Lama guanicoe) was conducted. Patterns of molecular genetic structure were described using 514 bp of mtDNA sequence and 14 biparentally inherited microsatellite markers from 314 samples. These individuals originated from 17 localities throughout the current distribution across Peru, Bolivia, Argentina and Chile. This confirmed well-defined genetic differentiation and subspecies designation of populations geographically separated to the northwest (L. g. cacsilensis) and southeast (L. g. guanicoe) of the central Andes plateau. However, these populations are not completely isolated, as shown by admixture prevalent throughout a limited contact zone, and a strong signal of expansion from north to south in the beginning of the Holocene. Microsatellite analyses differentiated three northwestern and 4-5 southeastern populations, suggesting patterns of genetic contact among these populations. Possible genetic refuges were identified, as were source-sink patterns of gene flow at historical and recent time scales. Conservation and management of guanaco should be implemented with an understanding of these local population dynamics while also considering the preservation of broader adaptive variation and evolutionary processes.
© 2012 Blackwell Publishing Ltd.
Figures
References
-
- Adler PB, Milchunas DG, Lauenroth Wk, Sala Oe, Burke IC. Functional traits of graminoids in semi-arid steppes: A test of grazing histories. Journal of Applied Ecology. 2004;41:653–663.
-
- Alpers DL, Van Vuuren BJ, Arctander P, Robinson TJ. Population genetics of the roan antelope (Hippotragus equinus) with suggestions for conservation. Molecular Ecology. 2004;13:1771–1784. - PubMed
-
- Arzamendia Y, Cassini MH, Vilá VL. Habitat use by vicuña Vicugna vicugna in Laguna Pozuelos Reserve, Jujuy, Argentina. Oryx. 2006;40:1–6.
-
- Avise JC. Phylogeography: The History and Formation of Species. Harvard University Press; Cambridge, Massachusetts: 2000.
-
- Baied CA, Wheeler JC. Evolution of High Andean Puna Ecosystems: Environment, climate, and culture change over the last 12,000 years in the Central Andes. Mountain Research and Development. 1993;13:145–156.
Publication types
MeSH terms
Substances
Grants and funding
LinkOut - more resources
Full Text Sources
Other Literature Sources
