

Investigation of the freely available easy-to-use software 'EZR' for medical statistics
- PMID: 23208313
- PMCID: PMC3590441
- DOI: 10.1038/bmt.2012.244
Investigation of the freely available easy-to-use software 'EZR' for medical statistics
Abstract
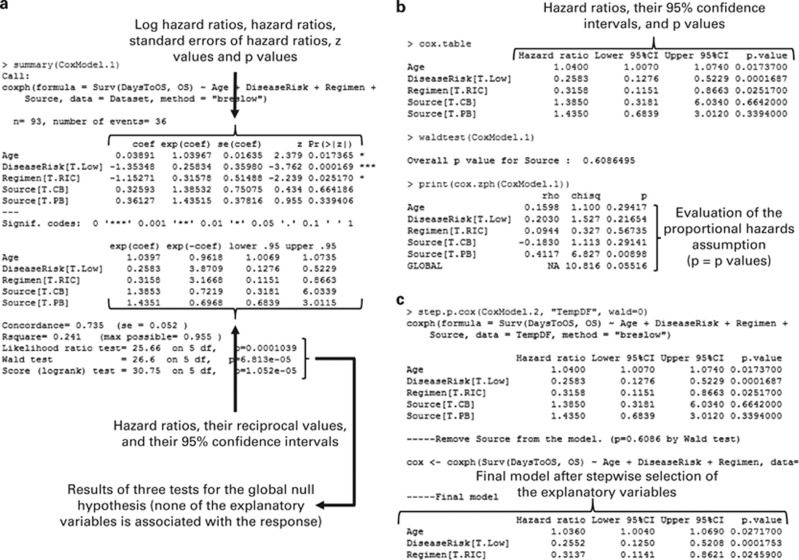
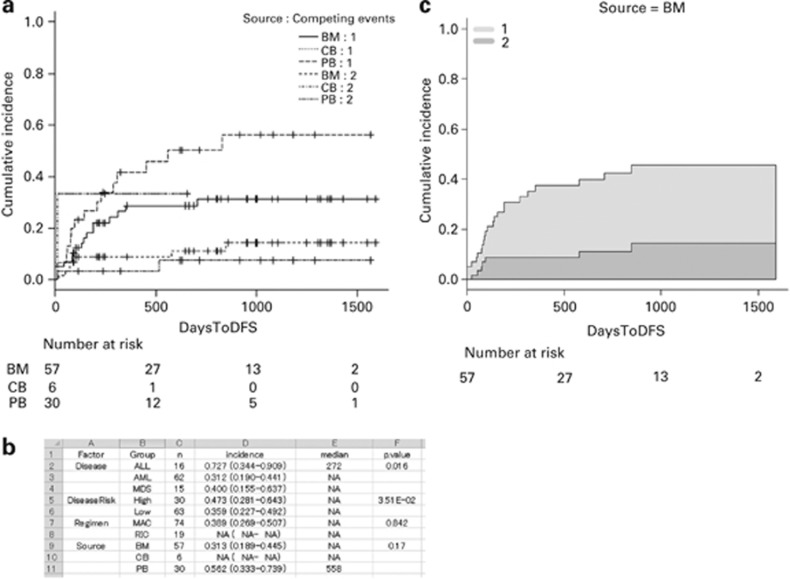
Although there are many commercially available statistical software packages, only a few implement a competing risk analysis or a proportional hazards regression model with time-dependent covariates, which are necessary in studies on hematopoietic SCT. In addition, most packages are not clinician friendly, as they require that commands be written based on statistical languages. This report describes the statistical software 'EZR' (Easy R), which is based on R and R commander. EZR enables the application of statistical functions that are frequently used in clinical studies, such as survival analyses, including competing risk analyses and the use of time-dependent covariates, receiver operating characteristics analyses, meta-analyses, sample size calculation and so on, by point-and-click access. EZR is freely available on our website (http://www.jichi.ac.jp/saitama-sct/SaitamaHP.files/statmed.html) and runs on both Windows (Microsoft Corporation, USA) and Mac OS X (Apple, USA). This report provides instructions for the installation and operation of EZR.
Figures
References
-
- The popularity of data analysis software. . http://r4stats.com/articles/popularity/ (Accessed 1 August 2012).
-
- Klein JP, Rizzo JD, Zhang MJ, Keiding N. Statistical methods for the analysis and presentation of the results of bone marrow transplants. Part I: unadjusted analysis. Bone Marrow Transplant. 2001;28:909–915. - PubMed
-
- Klein JP, Rizzo JD, Zhang MJ, Keiding N. Statistical methods for the analysis and presentation of the results of bone marrow transplants. Part 2: regression modeling. Bone Marrow Transplant. 2001;28:1001–1011. - PubMed
-
- Labopin M, Iacobelli S.Statistical guidelines for EBMT. http://portal.ebmt.org/sites/clint2/clint/Documents/StatGuidelines_oct20... (Accessed 1 August 2012).
-
- The Comprehensive R Archive Network . http://cran.r-project.org/ (Accessed 1 August 2012).
Publication types
MeSH terms
LinkOut - more resources
Full Text Sources
Other Literature Sources
Miscellaneous
