Review
. 2013 Apr;10(2):273-85.
doi: 10.1007/s13311-012-0161-6.

Neuroimaging in mitochondrial disorders

Affiliations
Review

Neuroimaging in mitochondrial disorders

Andrea L Gropman. Neurotherapeutics. 2013 Apr.

Abstract

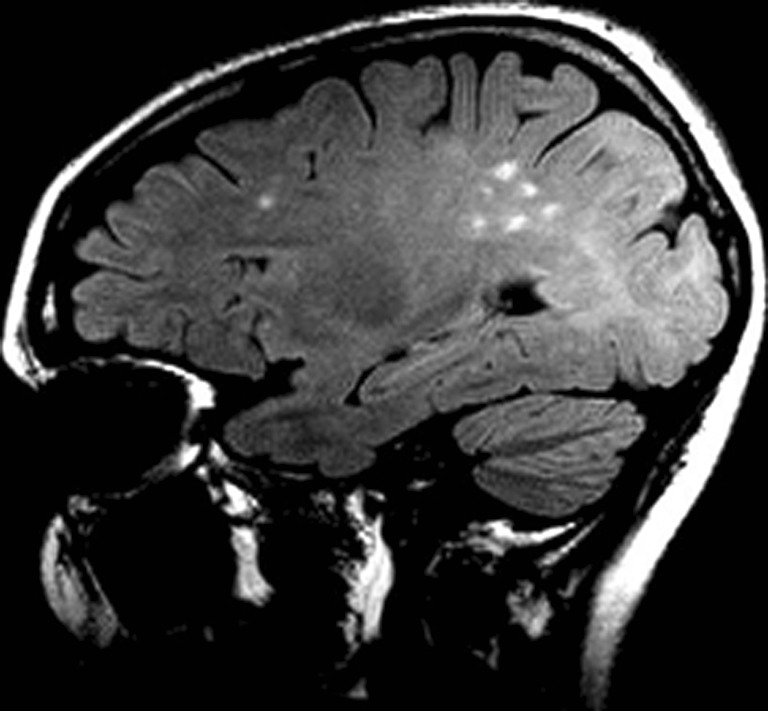
Mutations in either nuclear DNA or mitochondrial DNA can result in disruption of oxidative phosphorylation and lead to mitochondrial dysfunction. Mitochondrial disease manifestations occur predominantly in the central nervous system, peripheral nervous system, and/or involve several organ systems. The consequences range from manifestations of a single organ or tissues, such as muscle fatigue, if confined only to muscle, seizures, intellectual disabilities, dementia, and stroke (if to the central nervous system), leading to disability or even early death. The definitive diagnosis of a mitochondrial disorder can be difficult to establish. Criteria and checklists have been established and are more reflective of adult disease. However, in children, when symptoms suggest a mitochondrial disease, neuroimaging features may have more diagnostic impact and additionally these can be used to follow the course, evolution, and recovery of the disease. This review will demonstrate the common neuroimaging patterns in patients with mitochondrial disorders and point out how various newer neuroimaging modalities may be exploited to glean information as to the different aspects of mitochondrial dysfunction or resulting neurological and cognitive disruption, although reports in the literature using these methods remain sparse.


Figures

Fig. 1
Fig. 1
Example of white matter lesions as seen on fluid attenuation inversion recovery imaging that may not be seen on T2 imaging
Fig. 2
Fig. 2
Example of tissue parcellation for a volumetric study
Fig. 3
Fig. 3
Example of proton 1H magnetic resonance spectroscopy showing 2 subjects with peaks labeled
Fig. 4
Fig. 4
Examples of bilateral symmetric T2 right abnormalities in the basal ganglia. (a) Symmetric increased T2 signal is evident in the posterior and superior aspect of the head of the caudate (blue arrow), the anterior putamen (yellow arrows), and (b) the globus pallidus nuclei bilaterally (red arrows)
Fig. 5
Fig. 5
(a) A computed tomographic scan and (b) MRI of a patient with mitochondrial encephalopathy, lactic acidosis, and stroke syndrome (MELAS). (a) The computed tomographic scan shows typical location and appearance. (b) The MRI is showing subacute left parieto-occipito temporal infarction. The MRI also shows right temporoparietal and bifrontal lobe encephalomalacia owing to previous infarcts in this 15-year-old girl
Fig. 6
Fig. 6
This proton 1H magnetic resonance spectroscopy shows a very large lactate peak. The characteristics of the lactate peak are doublet with a 7 Hz split between the peaks (yellow arrow). The height of the left side of the doublet is usually slightly higher than the right, giving an asymmetric appearance. These characteristics are required to differentiate this signal from noise in the background of the spectrum. The concentration must be at least 1 mmol/kg tissue for a signal to be seen. Although this spectrum was acquired at a long TE, a shorter TE will also demonstrate a lactate peak. as well as other metabolites of interest
Fig. 7
Fig. 7
Cerebellar atrophy as a sign of a mitochondrial disorder. The yellow arrow demonstrates cerebellar atrophy
Fig. 8
Fig. 8
Abnormal, bilateral T2-hyperintense signal is again identified throughout the supratentorial and infratentorial white matter in these images of children with mitochondrial disorders
Fig. 9
Fig. 9
Two examples of delayed myelination

References

    1. Wallace DC, Fan W, Procaccio V. Mitochondrial energetics and therapeutics. Annu Rev Pathol Mech Dis. 2010;5:297–348. doi: 10.1146/annurev.pathol.4.110807.092314. - DOI - PMC - PubMed
    1. DiMauro S. Mitochondrial medicine. Biochim Biophys Acta. 2004;1658:107–114. - PubMed
    1. Thorburn DR. Mitochondrial disorders: prevalence, myths, and advances. J Inherit Metab Dis. 2004;27:349–362. doi: 10.1023/B:BOLI.0000031098.41409.55. - DOI - PubMed
    1. Anderson S, Bankier AT, Barrell BG, de Bruijn MH, et al. Sequence and organization of the human mitochondrial genome. Nature. 1981;290:457–465. doi: 10.1038/290457a0. - DOI - PubMed
    1. Dimauro S. A history of mitochondrial diseases. J Inherit Metab Dis. 2011;34:261–276. doi: 10.1007/s10545-010-9082-x. - DOI - PubMed

MeSH terms