. 2012 Dec;24(12):4892-906.
doi: 10.1105/tpc.112.105114. Epub 2012 Dec 3.

The SWI2/SNF2 chromatin remodeling ATPase BRAHMA represses abscisic acid responses in the absence of the stress stimulus in Arabidopsis

Collaborators, Affiliations

The SWI2/SNF2 chromatin remodeling ATPase BRAHMA represses abscisic acid responses in the absence of the stress stimulus in Arabidopsis

Soon-Ki Han et al. Plant Cell. 2012 Dec.

Abstract

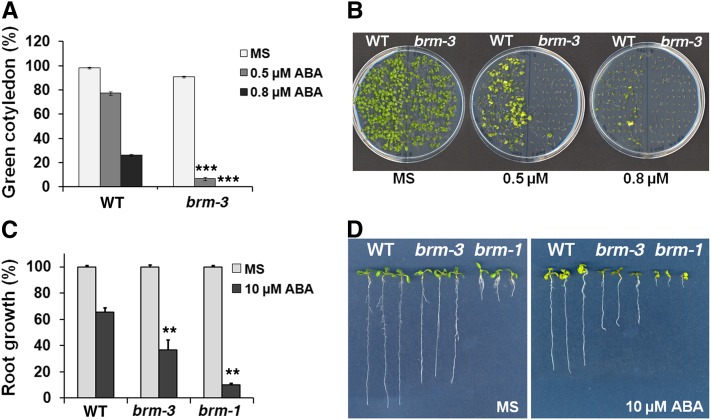
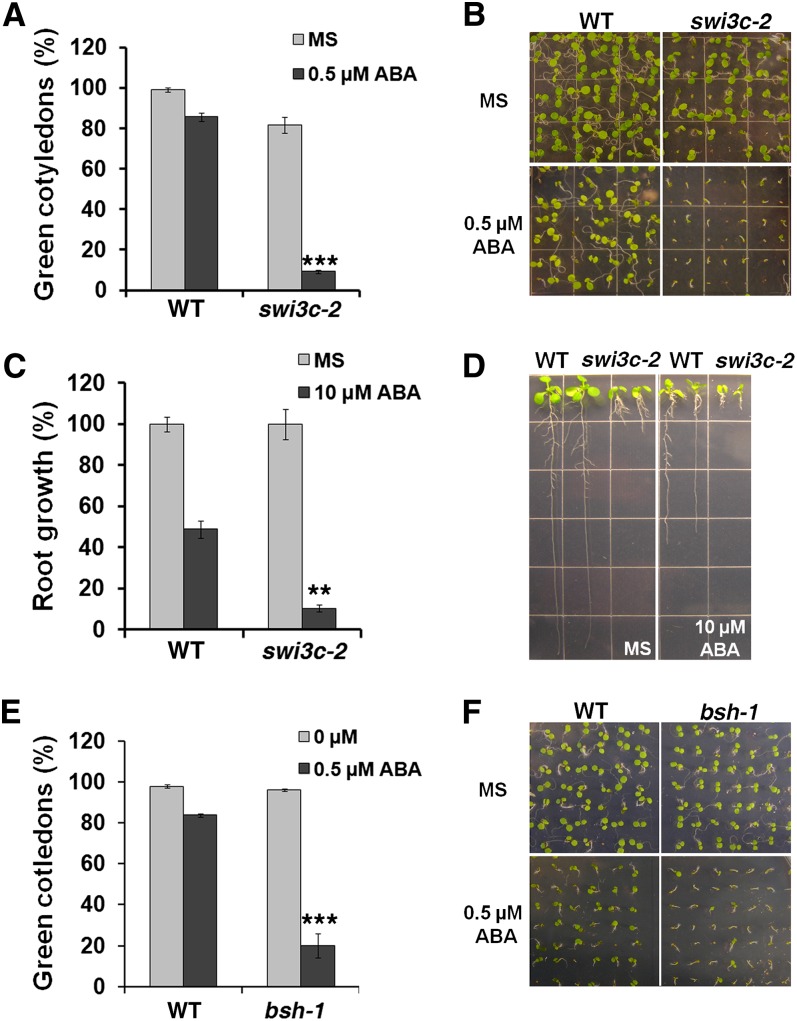
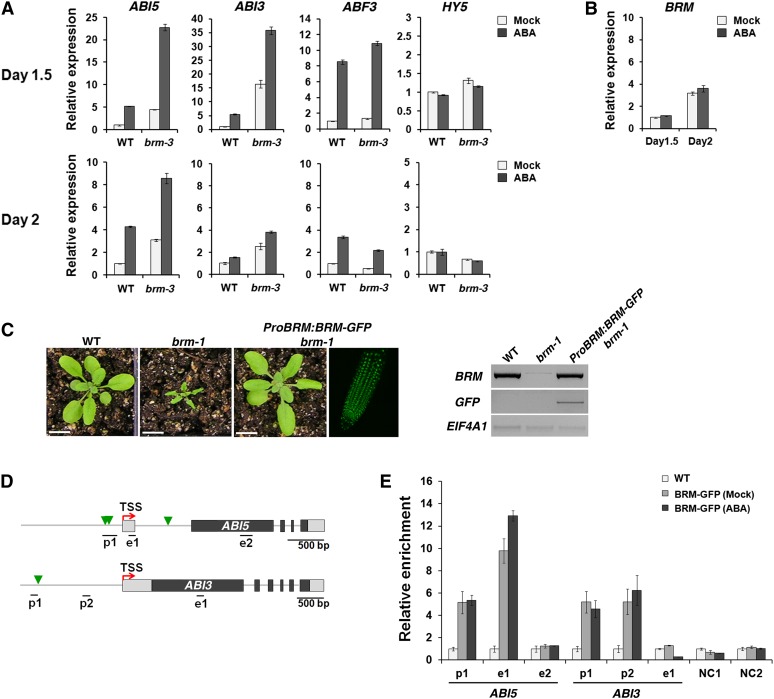
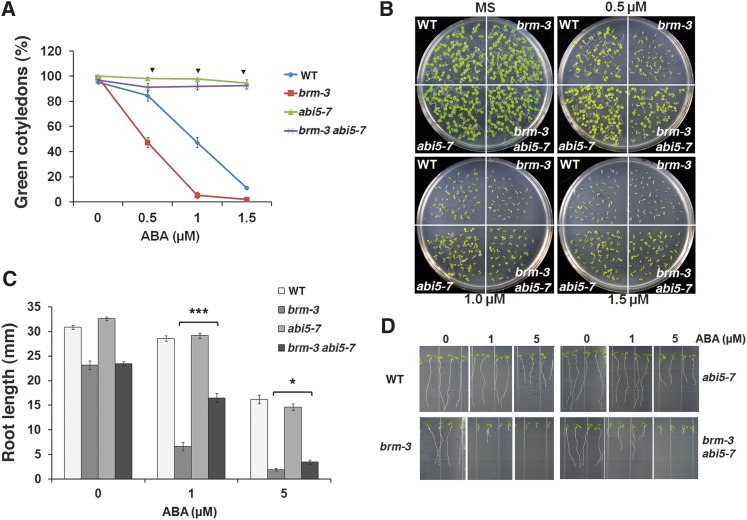
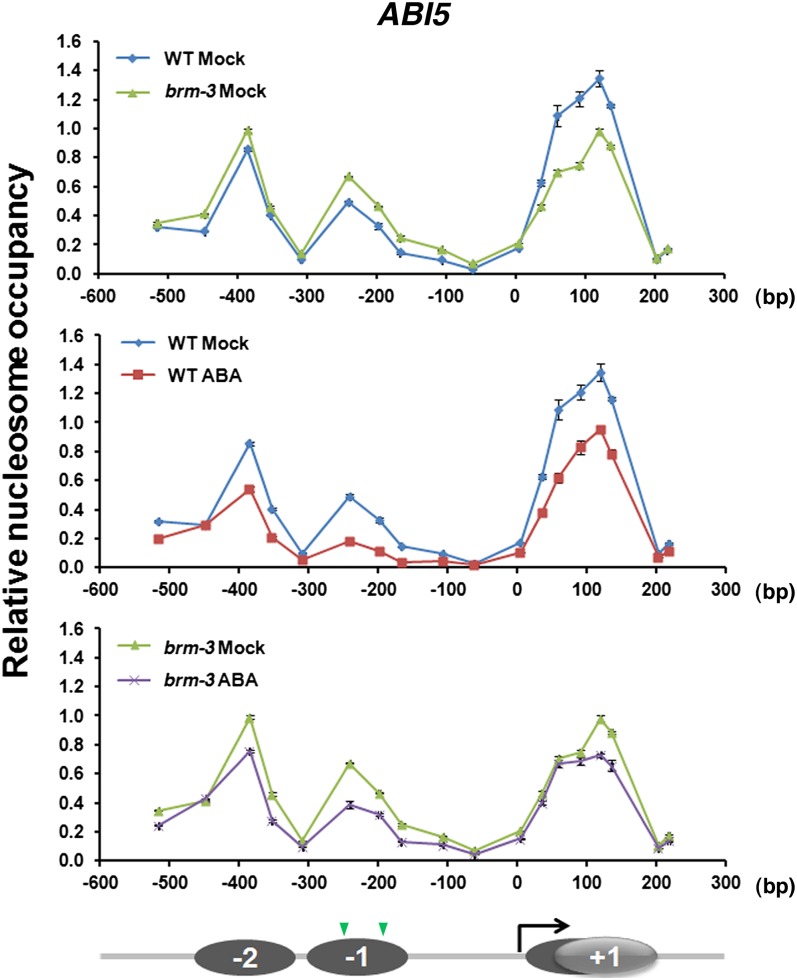
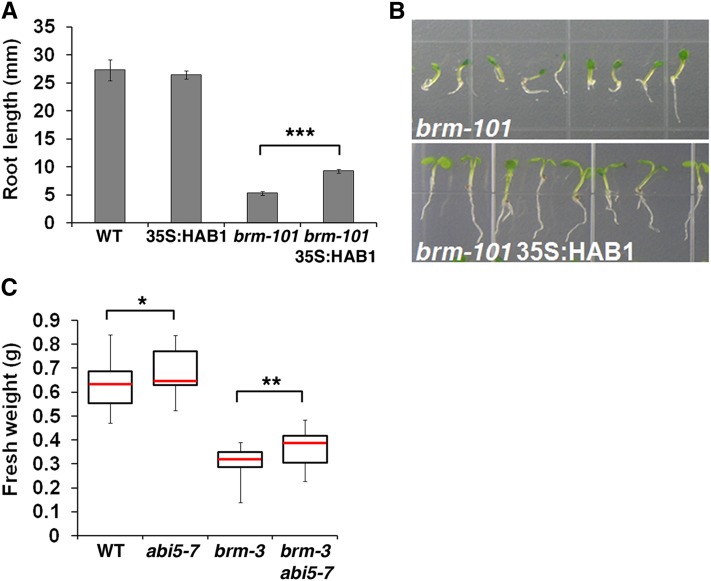
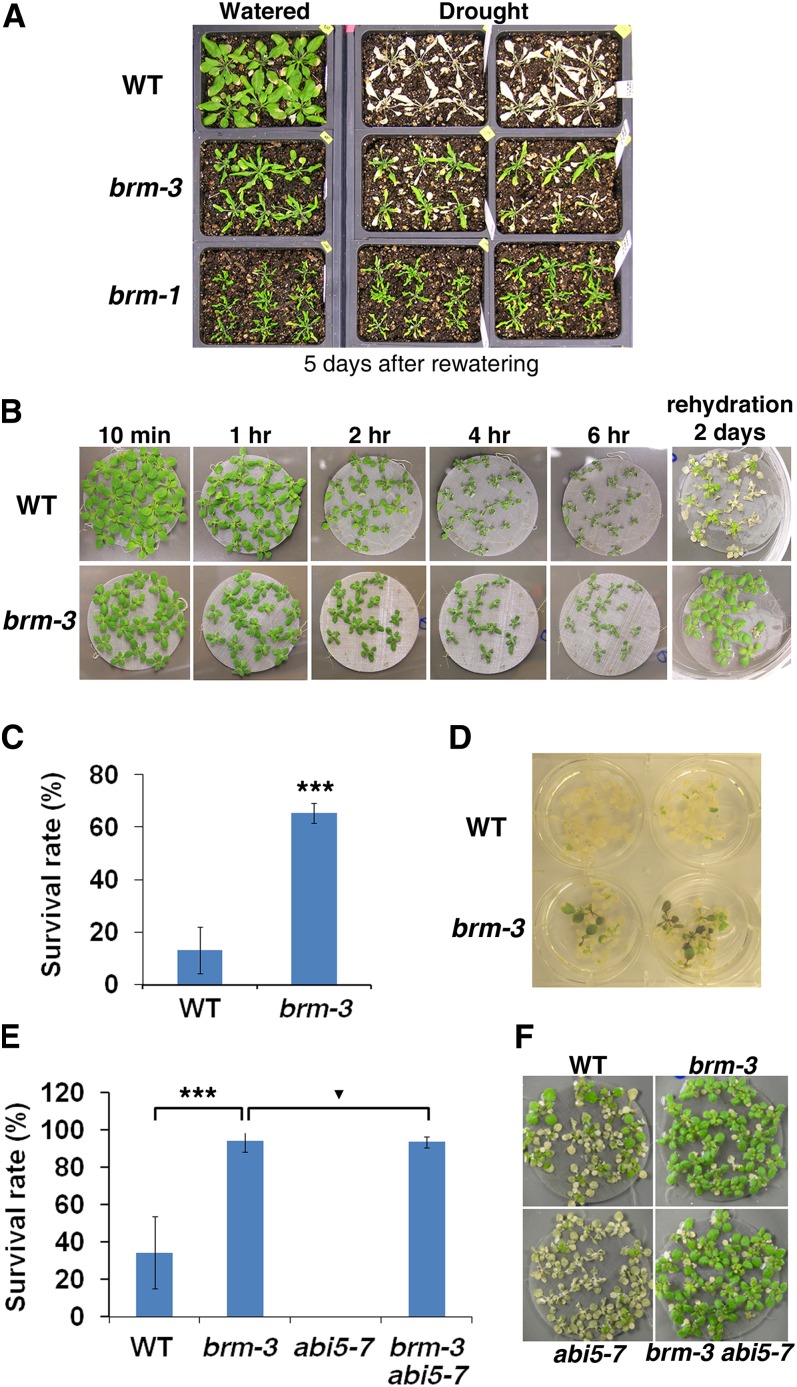
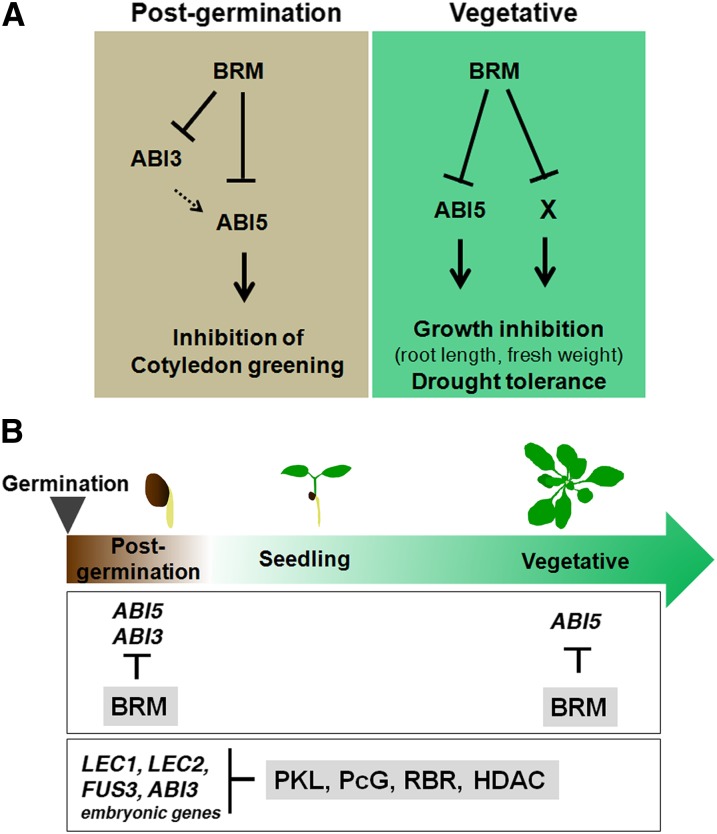
The survival of plants as sessile organisms depends on their ability to cope with environmental challenges. Of key importance in this regard is the phytohormone abscisic acid (ABA). ABA not only promotes seed dormancy but also triggers growth arrest in postgermination embryos that encounter water stress. This is accompanied by increased desiccation tolerance. Postgermination ABA responses in Arabidopsis thaliana are mediated in large part by the ABA-induced basic domain/leucine zipper transcription factor ABA INSENSITIVE5 (ABI5). Here, we show that loss of function of the SWI2/SNF2 chromatin remodeling ATPase BRAHMA (BRM) causes ABA hypersensitivity during postgermination growth arrest. ABI5 expression was derepressed in brm mutants in the absence of exogenous ABA and accumulated to high levels upon ABA sensing. This effect was likely direct; chromatin immunoprecipitation revealed BRM binding to the ABI5 locus. Moreover, loss of BRM activity led to destabilization of a nucleosome likely to repress ABI5 transcription. Finally, the abi5 null mutant was epistatic to BRM in postgermination growth arrest. In addition, vegetative growth defects typical of brm mutants in the absence of ABA treatment could be partially overcome by reduction of ABA responses, and brm mutants displayed increased drought tolerance. We propose a role for BRM in the balance between growth or stress responses.


Figures

Figure 1.
Figure 1.
brm Mutants Are Hypersensitive to ABA. (A) The percentage of germinated embryos that developed green cotyledons in the presence of 0.5 or 0.8 µM ABA in the wild type (WT) and in the hypomorph brm-3 mutant. Values are mean ± se from three independent experiments. Asterisks indicate statistical significance compared with wild-type values based on χ2 test (n = 250, P < 1E-10). (B) Representative pictures for the data shown in (A). Photographs were taken 11 (MS) and 18 (ABA) d after stratification. (C) Root growth inhibition of brm-1 null and brm-3 hypomorph mutants. Values are mean ± se from two independent experiments. Asterisks indicate statistical significance compared with wild-type values based on one-tailed Student’s t test (n = 10, P < 0.001). (D) Representative pictures for data shown in (C). Photographs were taken 10 d after stratification.
Figure 2.
Figure 2.
swi3c-2 and bsh-1 Mutants Are Hypersensitive to ABA. (A) The percentage of germinated embryos that developed green cotyledons in the presence of 0.5 µM ABA in the wild type (WT) and in the swi3c-2 mutant. Asterisks indicate statistical significance based on χ2 test (n = 100, P < 1E-10). (B) Representative pictures for data shown in (A) 7 d after stratification. (C) Root growth inhibition of the wild type and in the swi3c-2 mutant in the presence of 10 µM ABA relative to that observed on MS media. Asterisks indicate statistical significance based on Student’s t test (n = 20, P < 0.001). (D) Representative pictures for data shown in (C) 10 d after stratification. (E) The percentage of germinated wild-type and bsh-1 embryos that developed green cotyledons in the presence of 0.5 µM ABA. Values are mean ± se from two independent experiments. Asterisks indicate statistical significance based on χ2 test (n = 200, P < 1E-10). (F) Representative pictures for the data shown in (E) 5 d after stratification.
Figure 3.
Figure 3.
BRM Represses Expression of ABI5 and ABI3 during Postgermination Development. (A) Quantitative RT-PCR in 1.5- and 2-d-old wild-type (WT) and brm-3 mutants 1 h after mock or ABA (50 µM) treatment. (B) Quantitative RT-PCR in 1.5- and 2-d-old wild-type plants 1 h after mock or ABA treatment. Quantitative RT-PCR expression was normalized over that of EIF4A1, and expression levels in the mock-treated wild type were set to 1. Values are mean ± se of three technical replicates from one representative experiment. (C) Left: 3-week-old wild-type, brm-1, and brm-1 ProBRM:BRM-GFP plants. Center: GFP expression monitored by confocal microscopy in 2-d-old brm-1 ProBRM:BRM-GFP roots. Right: BRM expression (top panel), GFP expression (center panel), and EIF4A1 expression (bottom panel) tested by semiquantitative PCR. Bars = 1cm. (D) Diagram of the loci tested. Horizontal lines below the schematic, regions amplified by qPCR; green arrowheads, ABREs; gray box, 5′ or 3′ untranslated region; black box, exon; gray line, intergenic region or intron. (E) qPCR after anti-GFP ChIP in 1.5-d-old brm-1 ProBRM:BRM-GFP plants after mock or ABA (50 µM) treatment for 1 h. Relative enrichment is the percentage of input fold change after the percentage of input of the wild type was set to 1. Negative controls: exon regions of the retrotransposon TA3 (NC1) and of BRM (NC2). Values are mean ± se of three technical replicates from one representative experiment.
Figure 4.
Figure 4.
The Hypersensitive brm Phenotype Is Due to Derepression of ABI5. (A) Percentage of the germinated embryos that developed green cotyledons in the presence of 0.5, 1.0, and 1.5 µM ABA in the brm-3 abi5-7 double mutants compared with abi5-7, brm-3, and the wild type (WT) 7 d after stratification. Values are mean ± se from three independent experiments. Inverted triangles: no statistical significance compared with wild-type values (n > 100, P > 0.01). (B) Representative pictures for the data shown in (A). (C) Root length in the absence or presence of ABA (1 and 5 µM) in brm-3, abi5-7, and brm-3 abi5-7 double mutant plants compared with the wild type. Two-day-old plants were transferred to MS media containing ABA, and roots were measured at day 7. Asterisks: statistical significance based on one-tailed Student’s t test (n > 36, *P < 0.01, ***P < 1E-10). (D) Representative pictures for the data shown in (C).
Figure 5.
Figure 5.
BRM Is Required to Maintain High Occupancy of the +1 Nucleosome at the ABI5 Locus. MNase digestion followed by tiled primer qPCR to monitor nucleosome positioning and occupancy at the ABI5 locus. MNase qPCR was performed after a 1-h mock or ABA treatment in 2-d-old wild-type (WT) and brm-3 mutants. The fraction of undigested genomic DNA amplified for each amplicon was normalized to that of the −73 position of the negative control locus (gypsy-like retrotransposon; see Supplemental Figure 4 online). Values are mean ± se of three technical replicates from one representative experiment. The number on the x axis denotes distance (bp) from the TSS (0 bp). Below: Diagram of the positioned nucleosomes. Gray ovals, nucleosomes; black arrow, TSS; gray lines, genomic DNA; green arrowheads, ABREs.
Figure 6.
Figure 6.
The Growth Defects of the brm Mutant Are Partially Due to ABI5 Derepression and Enhanced ABA Response. (A) Root growth of the brm mutant in an ABA-insensitive mutant background (35S:HAB1). The root length of the wild type (WT), 35S:HAB1, brm-101, and brm-101 35S:HAB1 double mutant was measured 7 d after stratification. Values are mean ± se. Sample size was as follows: the wild type (n = 28), 35S:HAB1 (n = 27), brm-101 (n = 49), and brm-101 35S:HAB1 (n = 75). Asterisks indicate statistical significance based on one-tailed Student’s t test (P < 1E-10). (B) Representative pictures of data shown in (A). (C) Fresh weight of 4-week-old wild type, abi5-7, brm-3, and brm-3 abi5-7 double mutants grown in soil with sufficient water. n > 22 from three independent experiments. Asterisks indicate statistical significance (*P < 0.01 and **P < 0.001).
Figure 7.
Figure 7.
brm Mutants Have Increased Dehydration Tolerance. (A) Wild-type (WT), weak brm-3, and null brm-1 mutant plants grown in soil for 3 weeks followed by continued watering (left) or after drought treatment and rewatering (right). (B) The effect of dehydration on 2-week-old plate-grown plants. The wild type and brm-3 mutant during and after drought treatment. The pictures farthest to the right were taken 2 d after rehydration. (C) Survival rate (%) of 2-week-old wild-type and brm-3 seedlings after dehydration for 3 h under air flow. Values are mean ± se from four experiments (n = 42). Asterisks indicate statistical significance compared with wild-type values (P < 1E-10). (D) Representative pictures for data shown in (C). (E) Survival rate (%) of 2-week-old wild type, brm-3, abi5-7, and brm-3 abi5-7 double mutants after dehydration for 6 h. Values are mean ± se from two independent experiments (n > 53). Asterisks indicate statistical significance (***P < 1E-10). Inverted triangle indicates no statistical significance (P > 0.01). (F) Representative pictures for data shown in (E).
Figure 8.
Figure 8.
Model for Role of BRM in ABA Responses. (A) Role of BRM in ABA response at different developmental stages. Left: Inhibition of cotyledon greening during postgermination development. BRM negatively regulates the expression of two key ABA-related transcription factors ABI5 and ABI3. ABI3 acts upstream of ABI5 (Lopez-Molina et al., 2002). Solid arrows, direct regulation; dashed arrows, direct or indirect regulation. Right: Inhibition of growth during vegetative development. Additional direct BRM targets remain unidentified that act in parallel with ABI5. ABI5 has been implicated in drought tolerance (Lopez-Molina et al., 2001), although the increase of ABI5 expression alone was not responsible for the brm mutant drought tolerance. (B) Role of chromatin regulators in expression of ABA-responsive transcription factors during postgermination and vegetative development. BRM represses ABI5 expression during postgermination and vegetative development and ABI3 during postgermination development. Several chromatin regulators influence the developmental transition from postgermination development to seedling establishment. HDAC, histone deacetylase; PcG, Polycomb; RBR, Retinoblastoma-related protein.

References

    1. Aichinger E., Villar C.B., Farrona S., Reyes J.C., Hennig L., Köhler C. (2009). CHD3 proteins and polycomb group proteins antagonistically determine cell identity in Arabidopsis. PLoS Genet. 5: e1000605. - PMC - PubMed
    1. Alon U. (2007). Network motifs: Theory and experimental approaches. Nat. Rev. Genet. 8: 450–461 - PubMed
    1. Archacki R., Sarnowski T.J., Halibart-Puzio J., Brzeska K., Buszewicz D., Prymakowska-Bosak M., Koncz C., Jerzmanowski A. (2009). Genetic analysis of functional redundancy of BRM ATPase and ATSWI3C subunits of Arabidopsis SWI/SNF chromatin remodelling complexes. Planta 229: 1281–1292 - PubMed
    1. Battisti D.S., Naylor R.L. (2009). Historical warnings of future food insecurity with unprecedented seasonal heat. Science 323: 240–244 - PubMed
    1. Bensmihen S., Rippa S., Lambert G., Jublot D., Pautot V., Granier F., Giraudat J., Parcy F. (2002). The homologous ABI5 and EEL transcription factors function antagonistically to fine-tune gene expression during late embryogenesis. Plant Cell 14: 1391–1403 - PMC - PubMed

Publication types

MeSH terms

Substances

LinkOut - more resources