. 2013 Jan 1;190(1):147-58.
doi: 10.4049/jimmunol.1201458. Epub 2012 Dec 3.

A phospholipase C-γ1-independent, RasGRP1-ERK-dependent pathway drives lymphoproliferative disease in linker for activation of T cells-Y136F mutant mice

Affiliations

A phospholipase C-γ1-independent, RasGRP1-ERK-dependent pathway drives lymphoproliferative disease in linker for activation of T cells-Y136F mutant mice

Robert L Kortum et al. J Immunol. .

Abstract

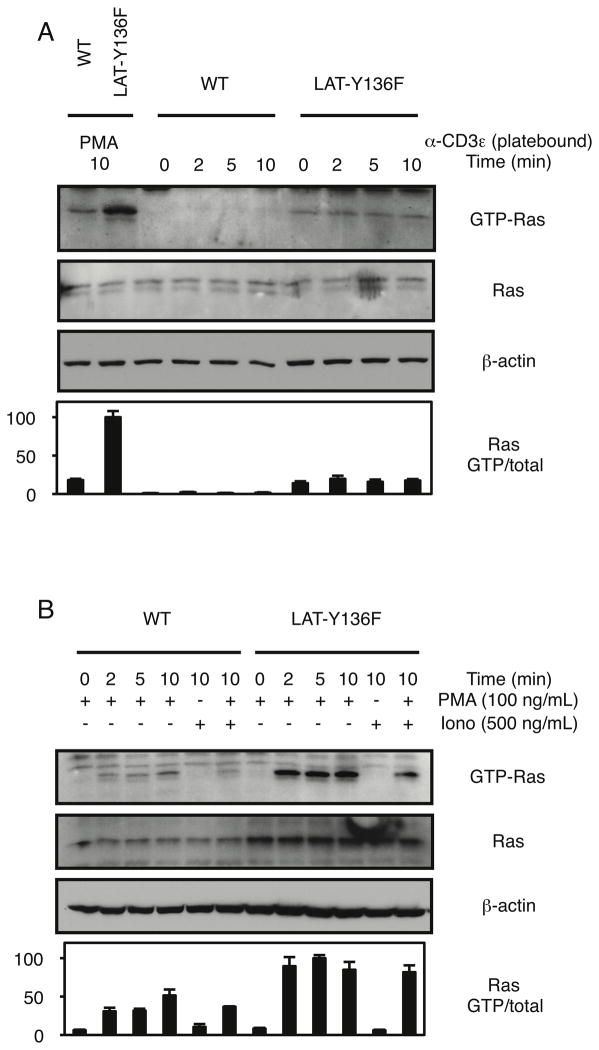
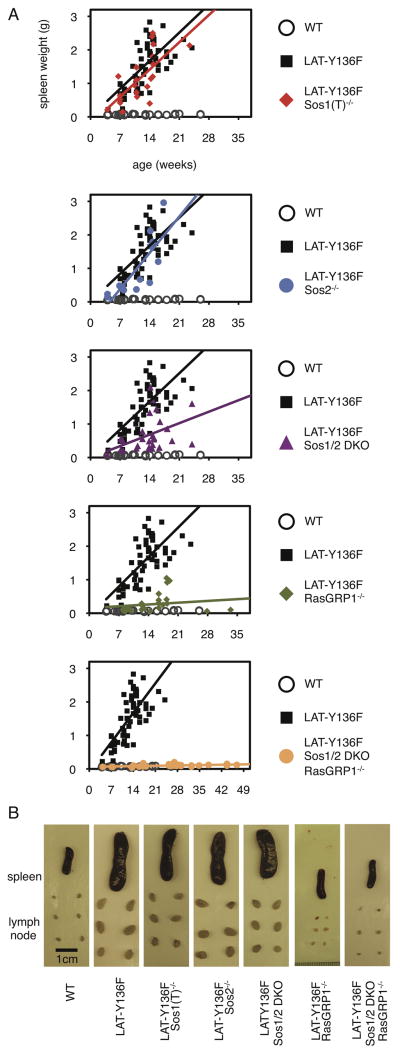
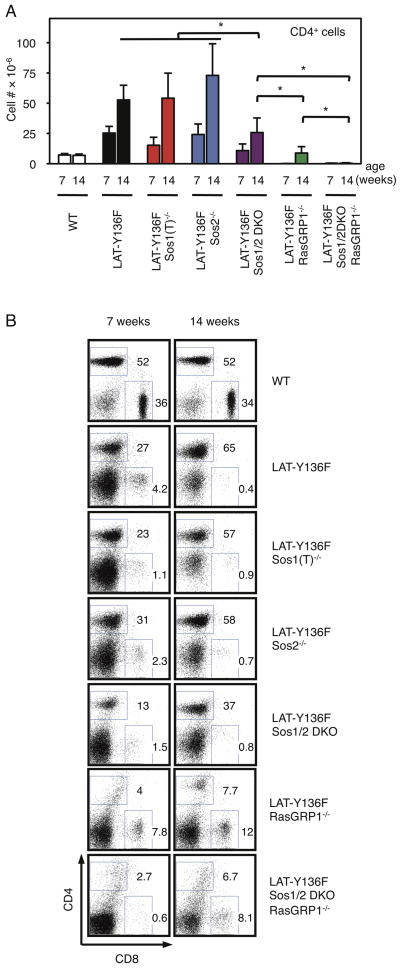
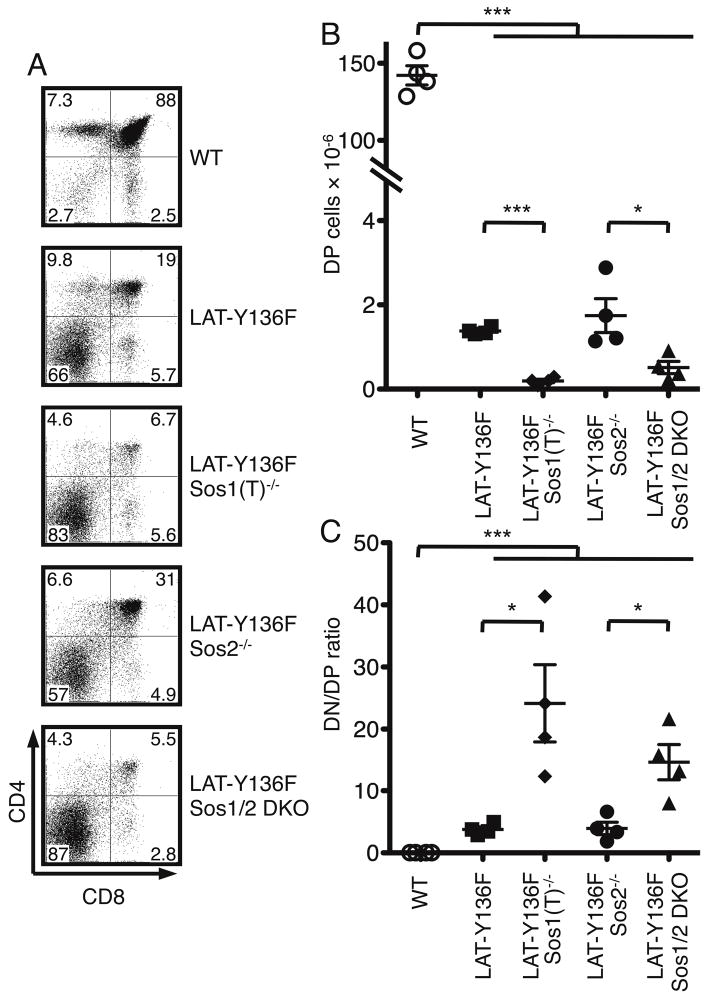
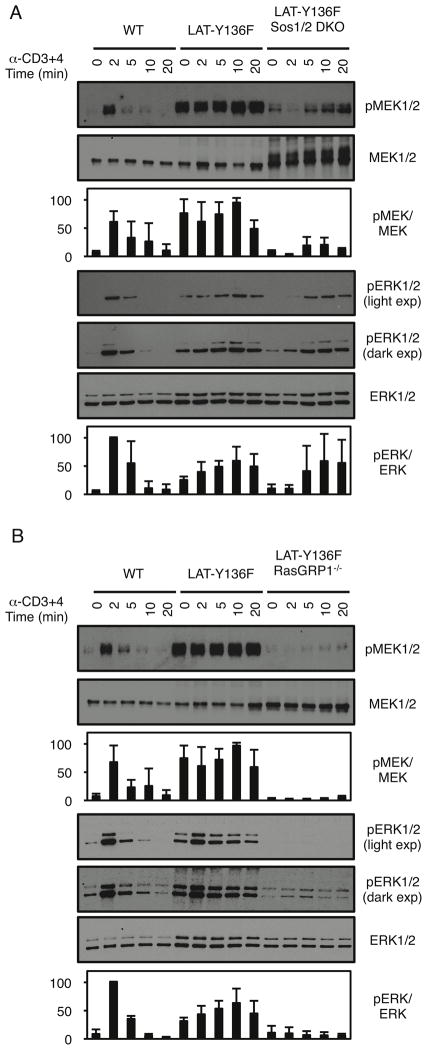
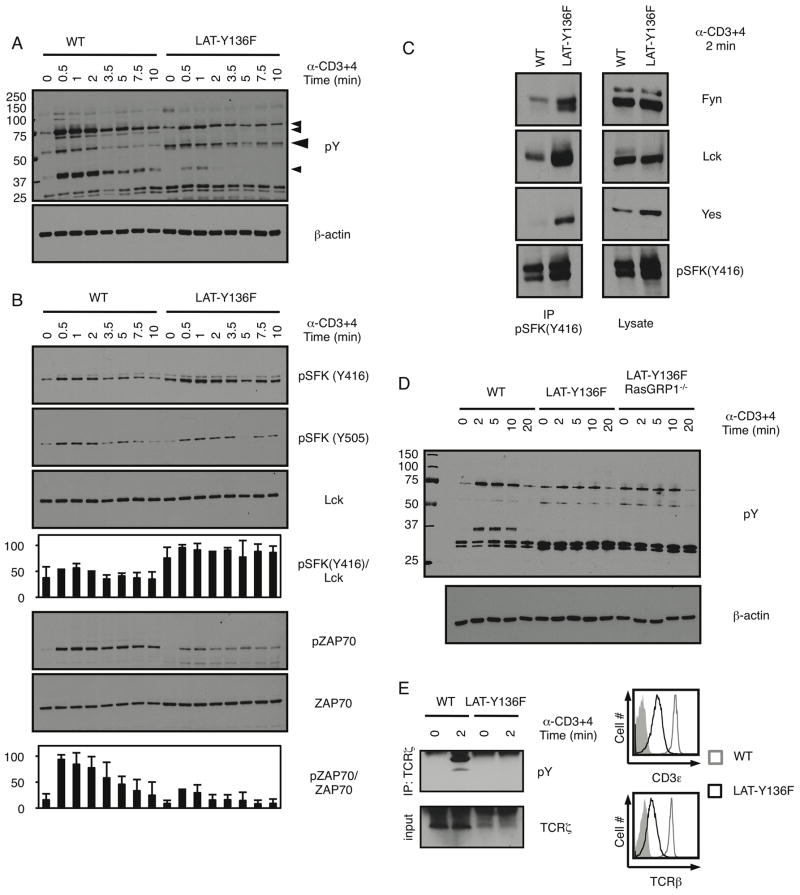
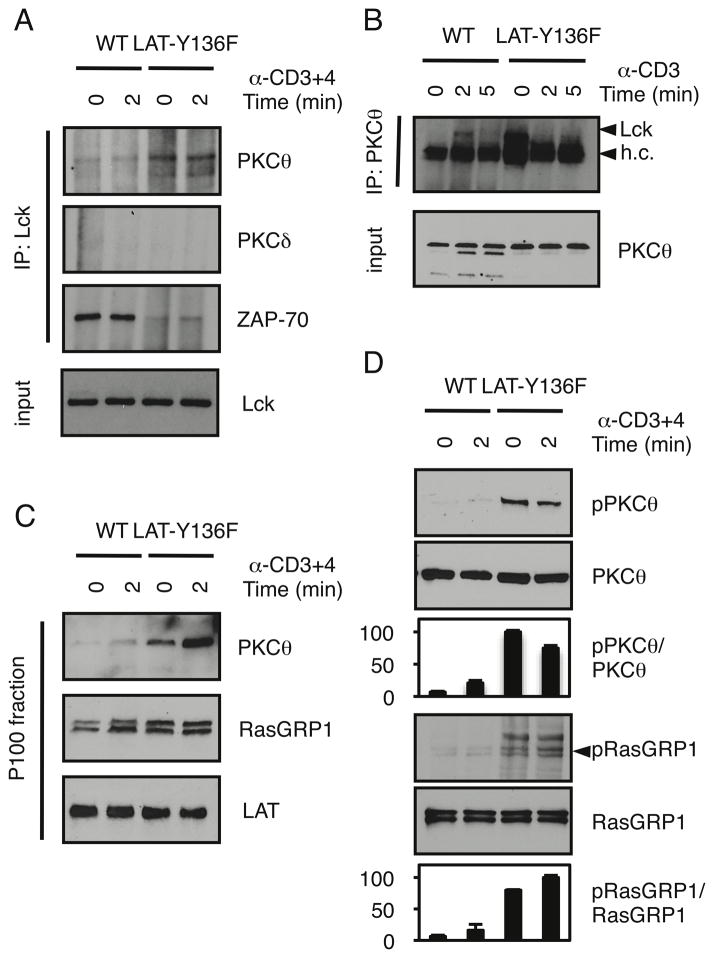
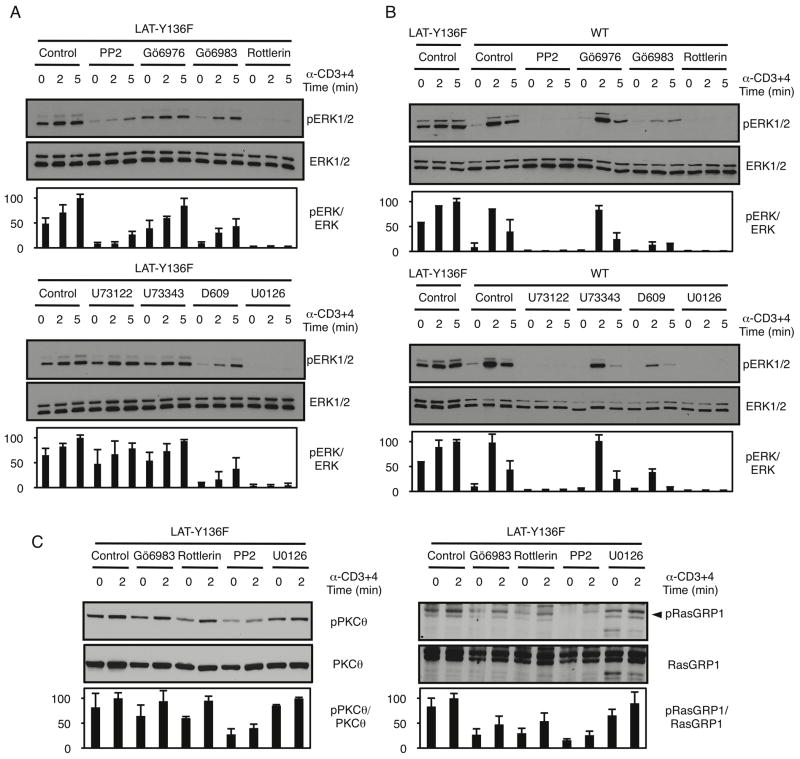
Mice expressing a germline mutation in the phospholipase C-γ1-binding site of linker for activation of T cells (LAT) show progressive lymphoproliferation and ultimately die at 4-6 mo age. The hyperactivated T cells in these mice show defective TCR-induced calcium flux but enhanced Ras/ERK activation, which is critical for disease progression. Despite the loss of LAT-dependent phospholipase C-γ1 binding and activation, genetic analysis revealed RasGRP1, and not Sos1 or Sos2, to be the major Ras guanine exchange factor responsible for ERK activation and the lymphoproliferative phenotype in these mice. Analysis of isolated CD4(+) T cells from LAT-Y136F mice showed altered proximal TCR-dependent kinase signaling, which activated a Zap70- and LAT-independent pathway. Moreover, LAT-Y136F T cells showed ERK activation that was dependent on Lck and/or Fyn, protein kinase C-θ, and RasGRP1. These data demonstrate a novel route to Ras activation in vivo in a pathological setting.


Figures

FIGURE 1
FIGURE 1. CD4+ T cells isolated from LAT-Y136F mice show elevated Ras activation
(A–B) Western blotting(above, quantified below) for activated Ras from a GST-RBD pulldown (top) or for total Ras or β-actin in whole cell lysates (WCL) from purified CD4+ LN cells from WT versus LAT-Y136F mice stimulated with (A) either 100 ng/mL PMA for ten minutes or 5 μg/mL platebound anti-CD3ε antibody for the indicated times or (B) 100 ng/mL PMA +/− 500 ng/mL Ionomycin for the indicated times. Data are representative of two independent experiments.
FIGURE 2
FIGURE 2. RasGRP1, and not Sos1/2, is the major RasGEF responsible for splenomegaly in LAT-Y136F mice
(A) Quantification of spleen weight versus time from WT mice, LAT-Y136F mice, LAT-Y136F mice deleted for Sos1 and/or Sos2, or LAT-Y136F mice deleted for RasGRP1 and/or Sos1/2. Each symbol represents one mouse. Data were accumulated over time from several experiments, and the same accumulated data from WT and LAT-Y136F mice are shown in each graph as controls to compare the LAT-Y136F/RasGEF crosses. LAT-Y136F/Sos1/2 DKO, LAT-Y136F/RasGRP1−/−, and LAT-Y136F/Sos1/2 DKO/RasGRP1−/− mice showed significant differences in the slope of the regression line (p<0.05) from LAT-Y136F, LAT-Y136F/Sos1−/−, or LAT-Y136F/Sos2−/− mice indicating a significant slowing of disease progression upon deletion of Sos1/2 and/or RasGRP1. In contrast, a similar rate in disease progression was noted when comparing LAT-Y136F/Sos1/2 DKO to LAT-Y136F/RasGRP1−/− mice. A complete statistical analysis of the data is given in Table SI. (B) Photographs of spleen (above) and isolated axillary, brachial, and inguinal lymph nodes (below) from 7-week-old mice indicated in A.
FIGURE 3
FIGURE 3. RasGRP1, and not Sos1/2, is the major RasGEF responsible for lymphoproliferation in LAT-Y136F mice
(A) Quantification of CD4+ LN T cell numbers from pooled axillary, brachial, and inguinal lymph nodes stained with anti-CD4 and anti-CD8 from 7 or 14-week-old mice indicated in Fig. 2. n≥4 for each group. Data are represented as mean+/− SD. * p<0.05. (B) Flow cytometry dot plots of pooled axillary, brachial, and inguinal lymph nodes stained with anti-CD4 and anti-CD8 from mice indicated in A.
FIGURE 4
FIGURE 4. Sos1-dependent pre-TCR developmental block does not correlate with delayed disease in LAT-Y136F mice
(A) Flow cytometry dot plots of thymocytes stained with anti-CD4 and anti-CD8 from 4-week-old WT mice, LAT-Y136F mice, or LAT-Y136F mice deleted for Sos1 and/or Sos2. n=4 for each group. (B) Total numbers of DP thymocytes isolated from 4-week-old mice from (A) (n=4 for each). Each symbol denotes an individual mouse and the bar denotes the average for the group. * p<0.05, ***p<0.001.<n=br>(C) The DN/DP ratio from (A). * p<0.05, ***p<0.001.
FIGURE 5
FIGURE 5. RasGRP1 is the major RasGEF responsible for ERK activation in T cells from LAT-Y136F mice
(A–B) Western blotting (above, quantified below) for phospho-MEK, total MEK, phospho-ERK, or total ERK in WCL from purified CD4+ LN cells from WT, LAT-Y136F, or LAT-Y136F mice crossed to Sos1/2 DKO mice (A) or RasGRP1−/− mice (B) stimulated with 10 μg/mL soluble anti-CD3ε + anti-CD4 antibodies. All stimulations were for the indicated times in minutes. Total MEK blots were loaded in parallel, and run at the same time as pMEK blots. Data are representative of three independent experiments.
FIGURE 6
FIGURE 6. Altered activation of upstream kinases in T cells from LAT-Y136F mice
(A–B) Western blotting for phospho-tyrosine (4G10) and β-actin (A), or active phospho-pan Src (Y416), inactive phospho-pan Src (Y505), total Lck, phospho-ZAP70, and total ZAP70 (above, quantified below) (B) in WCL from purified CD4+ LN cells from WT and LAT-Y136F mice stimulated with 10 μg/mL soluble anti-CD3ε + anti-CD4 antibodies for the indicated times in minutes. On the phospho-tyrosine blot, small arrowheads represent putative SLP-76, ZAP70, and LAT bands and the large arrowhead a putative SFK doublet as outlined in the text. Data are representative of two independent experiments. (C) Western blotting for Lck, Fyn, Yes, and phospho-pan Src (Y416) in anti-phospho-pan Src (Y416) immunoprecipitates (left) or WCL (right) from purified CD4+ LN cells from WT and LAT-Y136F mice stimulated with 10 μg/mL soluble anti-CD3ε + anti-CD4 antibodies for 2 minutes. Data are representative of two independent experiments. (D) Western blotting for phospho-tyrosine (4G10) and β-actin in WCL from purified CD4+ LN cells from WT, LAT-Y136F, and LAT-Y136F/RasGRP1−/− mice stimulated with 10 μg/mL soluble anti-CD3ε + anti-CD4 antibodies for the indicated times in minutes. Data are representative of three independent experiments. (E) Western blotting for pY and TCRζ in TCRζ IPs from purified CD4+ LN cells from either WT or LAT-Y136F mice stimulated with 10 μg/mL soluble anti-CD3ε antibodies for the indicated times in minutes, representative data from two independent experiments (left); and histogram of anti-CD3ε (above) or anti-TCRβ (below) staining in gated, CD4+ lymphocytes from 8-week-old WT versus LAT-Y136F mice.
FIGURE 7
FIGURE 7. Enhanced Lck/PKCθ association and RasGRP1 membrane localization in CD4+ T lymphocytes isolated from LAT-Y136F mice
(A) Western blotting for PKCθ, PKCδ, and ZAP70 in Lck IPs and total Lck in WCL from purified CD4+ LN cells from either WT or LAT-Y136F mice stimulated with 10μg/mL soluble anti-CD3ε antibodies for the indicated times in minutes. Data are representative of three independent experiments. (B) Western blotting for Lck in PKCθ IPs and total PKCθ in WCL from purified CD4+ LN cells from either WT or LAT-Y136F mice stimulated with 10 μg/mL soluble anti-CD3ε antibodies for the indicated times in minutes. h.c. denotes immunoglobulin heavy chain. Data are representative of three independent experiments. (C) Western blotting for PKCθ, RasGRP1, and LAT in membrane (P100) fractions from purified CD4+ LN cells from either WT or LAT-Y136F mice stimulated with 10 μg/mL soluble anti-CD3ε antibodies for the indicated times in minutes. Data are representative of two independent experiments. (D) Western blotting for pPKCθ (T538), total PKCθ, pRasGRP1 (T184, doublet denoted by arrow) and total RasGRP1 (above, quantified below) in WCL from purified CD4+ LN cells from either WT or LAT-Y136F mice stimulated with 10 μg/mL soluble anti-CD3ε + anti-CD4 antibodies for the indicated times in minutes. Data are representative of four independent experiments.
FIGURE 8
FIGURE 8. SFK and novel PKC signaling are required for ERK hyper-activation in CD4+ T lymphocytes isolated from LAT-Y136F mice
(A–B) Western blotting for phospho-ERK and total ERK (above, quantified below) in WCL from purified CD4+ LN cells from either LAT-Y136F (A) or WT (B) mice. Lysates were pre-treated with the indicated inhibitors and then stimulated with 10 μg/mL soluble anti-CD3ε + anti-CD4 antibodies. DMSO-treated cells represent the vehicle control, and MEK1/2 inhibition by U0126 is the positive control showing a complete loss of ERK phosphorylation. All stimulations were for the indicated times in minutes. Data are representative of three independent experiments. (C) Western blotting for pPKCθ (T538), total PKCθ, pRasGRP1 (T184, doublet denoted by arrow), and total RasGRP1 (above, quantified below) in WCL from purified CD4+ LN cells from LAT-Y136F mice. Lysates were pre-treated with the indicated inhibitors and then stimulated with 10 μg/mL soluble anti-CD3ε + anti-CD4 antibodies. DMSO-treated cells represent the vehicle control. All stimulations were for the indicated times in minutes. Data are representative of two independent experiments.

Similar articles

Cited by

References

    1. Smith-Garvin JE, Koretzky GA, Jordan MS. T cell activation. Annu Rev Immunol. 2009;27:591–619. - PMC - PubMed
    1. Zhu M, Janssen E, Zhang W. Minimal requirement of tyrosine residues of linker for activation of T cells in TCR signaling and thymocyte development. J Immunol. 2003;170:325–333. - PubMed
    1. Balagopalan L, Coussens NP, Sherman E, Samelson LE, Sommers CL. The LAT story: a tale of cooperativity, coordination, and choreography. Cold Spring Harb Perspect Biol. 2010;2:a005512. - PMC - PubMed
    1. Zhang W, Sloan-Lancaster J, Kitchen J, Trible RP, Samelson LE. LAT: the ZAP-70 tyrosine kinase substrate that links T cell receptor to cellular activation. Cell. 1998;92:83–92. - PubMed
    1. Zhang W, Trible RP, Zhu M, Liu SK, McGlade CJ, Samelson LE. Association of Grb2, Gads, and phospholipase C-gamma 1 with phosphorylated LAT tyrosine residues. Effect of LAT tyrosine mutations on T cell angigen receptor-mediated signaling. J Biol Chem. 2000;275:23355–23361. - PubMed

Publication types

MeSH terms