

Reconstructing mammalian sleep dynamics with data assimilation
- PMID: 23209396
- PMCID: PMC3510073
- DOI: 10.1371/journal.pcbi.1002788
Reconstructing mammalian sleep dynamics with data assimilation
Abstract
Data assimilation is a valuable tool in the study of any complex system, where measurements are incomplete, uncertain, or both. It enables the user to take advantage of all available information including experimental measurements and short-term model forecasts of a system. Although data assimilation has been used to study other biological systems, the study of the sleep-wake regulatory network has yet to benefit from this toolset. We present a data assimilation framework based on the unscented Kalman filter (UKF) for combining sparse measurements together with a relatively high-dimensional nonlinear computational model to estimate the state of a model of the sleep-wake regulatory system. We demonstrate with simulation studies that a few noisy variables can be used to accurately reconstruct the remaining hidden variables. We introduce a metric for ranking relative partial observability of computational models, within the UKF framework, that allows us to choose the optimal variables for measurement and also provides a methodology for optimizing framework parameters such as UKF covariance inflation. In addition, we demonstrate a parameter estimation method that allows us to track non-stationary model parameters and accommodate slow dynamics not included in the UKF filter model. Finally, we show that we can even use observed discretized sleep-state, which is not one of the model variables, to reconstruct model state and estimate unknown parameters. Sleep is implicated in many neurological disorders from epilepsy to schizophrenia, but simultaneous observation of the many brain components that regulate this behavior is difficult. We anticipate that this data assimilation framework will enable better understanding of the detailed interactions governing sleep and wake behavior and provide for better, more targeted, therapies.
Conflict of interest statement
The authors have declared that no competing interests exist.
Figures


 (blue) were passed to the unscented kalman filter (UKF) framework to track and reconstruct all other variables. Shown are the firing rates for the Wake-active (LC), NREM-active (VLPO), and REM-active (LDT/PPT) cell groups, along with thalamic noise
  . The framework was given the same parameters used to generate the original data. In both A and B the same data was tracked with model initial conditions chosen randomly. After a transient period, reconstructed (red) Wake and NREM dynamics are close to true (black) dynamics. Without
  optimization the dynamics of
  are essentially ignored. After
  optimization at least some of the stochastic
  dynamics - those that measurably affect the dynamics of
  - are reconstructed and reconstruction of REM dynamics is improved.
 for the DB model with no thalamic noise and default values of
  .
.  is an empirical measure of how well variable
  is reconstructed from measurement of variable
  .
.  with perfect reconstruction being 1. Here
  was computed using 12 hours of data. From the
  matrix, we observe that
  (row) is poorly observed - poorly reconstructed - from most variables, although its measurement (column) yields good reconstruction of almost all other variables.
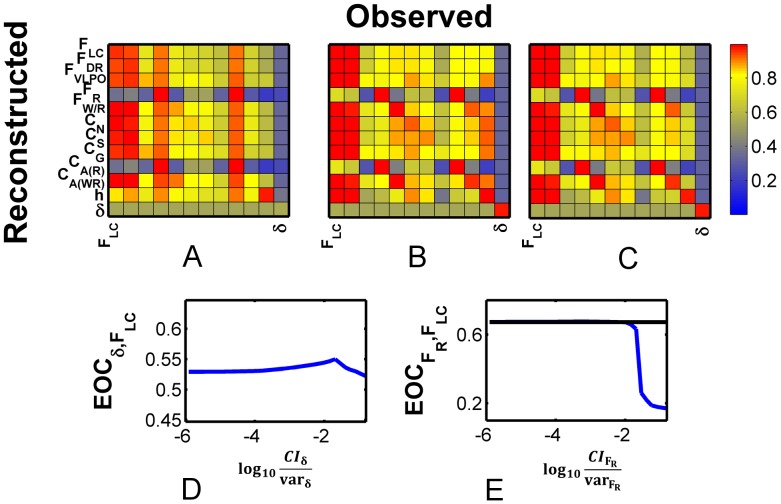
 can be used to guide optimization of the covariance inflater
  : Poorly observed variables across their rows - low
  - should have decreased
  . Variables whose measurement yields poor reconstruction columnwise- low
  - should have increased
  . Algorithmically, we iteratively adjust
  for the variable
  with the overall lowest mean row or column. In A–C are shown the
  matrix after each optimization iteration for the full DB model with thalamic noise. A)
  computed with default values for
  , i.e.
  . Note that the lowest mean row/column corresponds to the measurement of
  , therefore we optimize
  first. B)
  after optimization of
  . C)
. C)  after optimizing
  . Shown are
  as a function of D)
  for optimization step between A and B and E)
  for optimization steps between B and C. Optimal values of
  are chosen from the peaks of these plots.
 to the true value. B) Trajectories for the short model generated (magenta), reconstructed (red), and true (black)
  dynamics for different periods of the convergence of
  . Note that initially, for
  significantly different than the true value, the short trajectories diverge quickly from the reconstructed values, and the reconstructed values of of
  are different from the true values. When
  approaches the true value, both short model-generated and reconstructed trajectories approach the true values. C) Reconstruction metric
  computed for each data assimilation window for three of the variables. As a reference point, the reconstruction metric for the original noisy observation of
  is shown in blue. Note that although the parameter estimation essentially optimizes short model generated forecasts, it has the effect of optimizing hidden variable reconstruction.
 and
and  from the full FBFD model were assimilated with a version of the DB model that represented input from the SCN as a quasi-static parameter
  whose value was estimated and tracked in 80% overlapping half hour windows. SCN activity imposes circadian and light-driven dynamics that modulate sleep-wake cycles and prevalence of either sleep or wake activity. A) Short excerpts of reconstructed dynamics for various phases of the circadian cycle. B) Estimated (magenta) and true (black) value of the tracked parameter
  . Note that the tracked value is an estimate, with inherent smoothing on the time scale of a half hour, and therefore does not reconstruct all of the detailed dynamics of the true value which oscillates due to the interplay between the core sleep-wake regulatory cell groups and the SCN. C) Normalized reconstruction error for various variables. As a reference, the reconstruction error for the noisy
  measurement is shown in blue. The reconstruction of unobserved variables
  and homeostatic sleep drive
  is quite good as indicated by small
  values.
 ,
,  , and
, and  , and their variances. We use the UKF to reconstruct the full variable state space from these observations. A) Probability distributions of firing rates for
  ,
,  and
and  during Wake (black), NREM (red), and REM (blue). These firing rates were generated from the filter-model. B) Hypnogram of observed SOV for a 1 hour time series, with colors to match (A). C) Reconstructed (red) and true (black) traces for
  ,
,  ,
,  , and
, and  . The inferred observation for
  is also shown (blue). After a transient period, the reconstruction converges to the true value, even for the homeostatic drive variable
  which was not observed. However, details of the dynamics that are not accounted for by the state-of-vigilance (SOV) such as brief awakenings and transitions into and out of NREM are not reconstructed well.
 dynamics for different periods of the convergence of
  . C) Reconstruction metric
  computed for each data assimilation window for three of the variables. Horizontal dashed lines correspond to
  computed from the state-conditioned discrete map used to translate the SOV to model space. Note that once the parameter is optimized, the UKF reconstruction far outperforms the observation map.
References
-
- Saper CB, Scammel TE, Lu J (2005) Hypothalamic regulation of sleep and circadian rhythms. Nature 437: 1257–63. - PubMed
-
- Tamakawa Y, Karashima A, Koyoma Y, Katayama N, Nakao M (2006) A quartet neural system model orchestrating sleep and wakefulness mechanisms. J Neurophysiol 95: 2055–69. - PubMed
-
- Diniz Behn CG, Booth V (2010) Simulating microinjection experiments in a novel model of the rat sleep-wake regulatory network. J Neurophysiol 103: 1937–1953. - PubMed
-
- Phillips JK, Robinson PA (2007) A quantitative model of sleep-wake dynamics based on the physiology of the brainstem ascending arousal system. J Biological Rhythms 22: 167–179. - PubMed
Publication types
MeSH terms
Grants and funding
LinkOut - more resources
Full Text Sources
Molecular Biology Databases
