. 2012;8(11):e1003042.
doi: 10.1371/journal.pgen.1003042. Epub 2012 Nov 29.

A genome-scale RNA-interference screen identifies RRAS signaling as a pathologic feature of Huntington's disease

Affiliations

A genome-scale RNA-interference screen identifies RRAS signaling as a pathologic feature of Huntington's disease

John P Miller et al. PLoS Genet. 2012.

Abstract

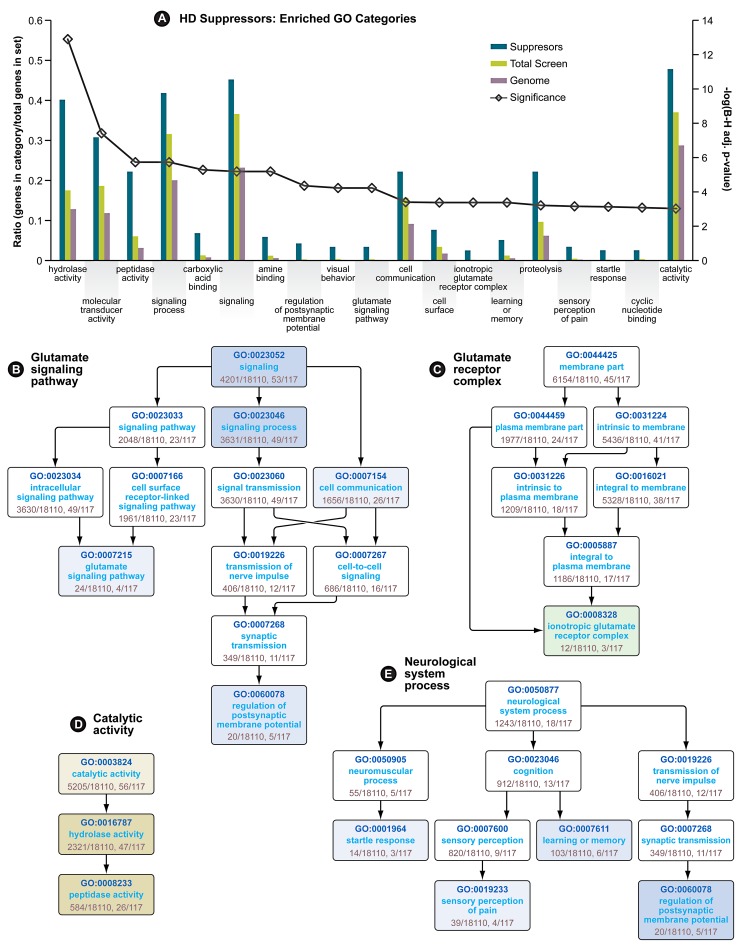
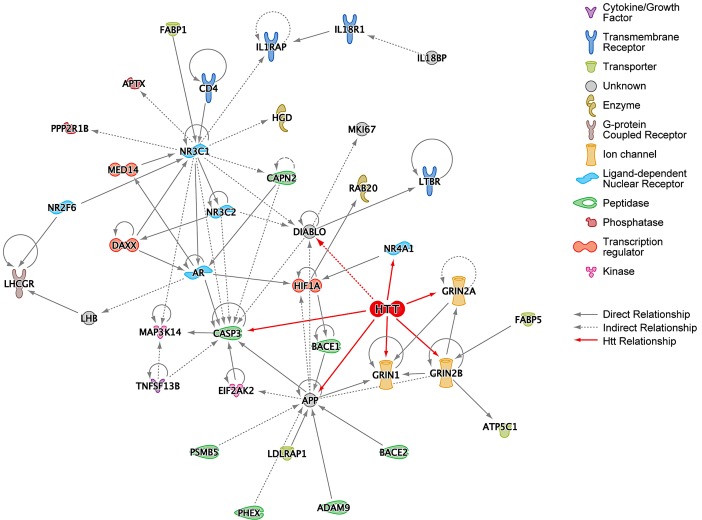
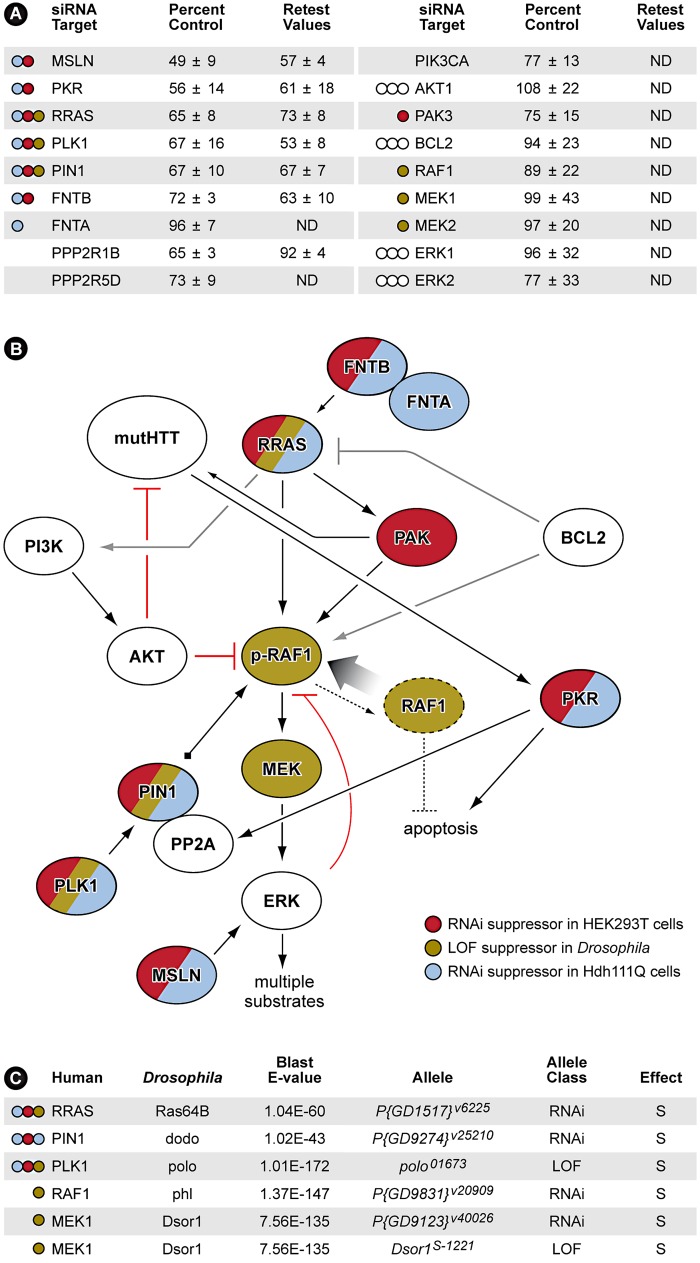
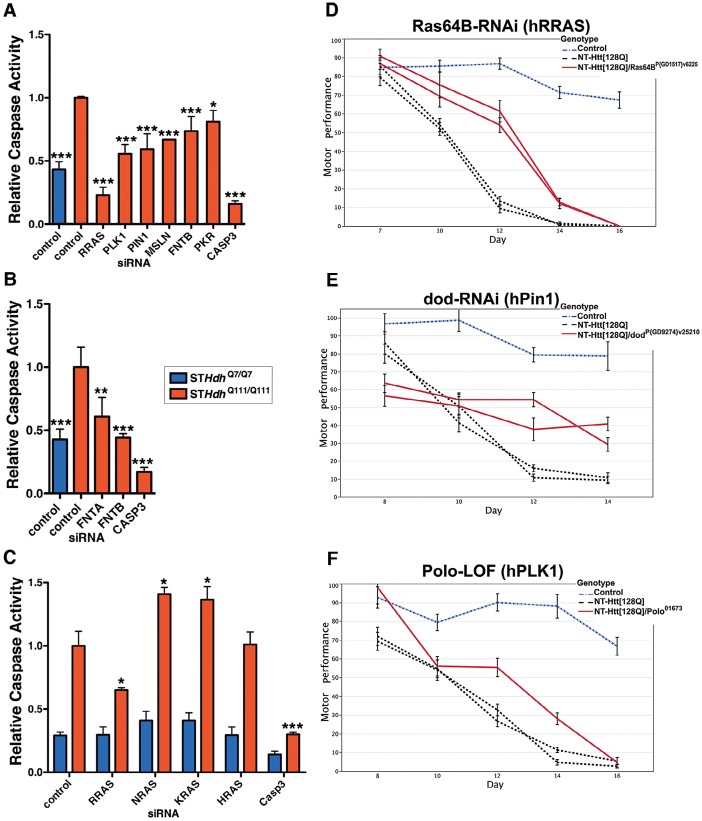
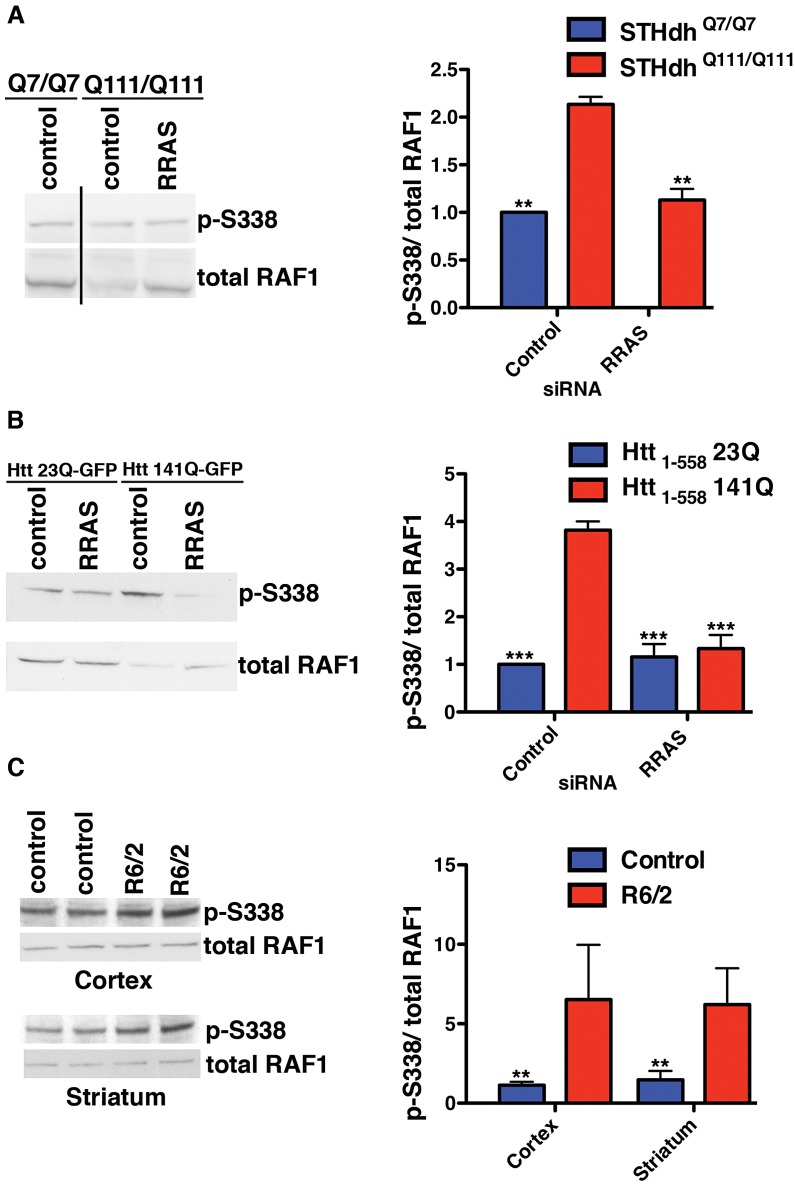
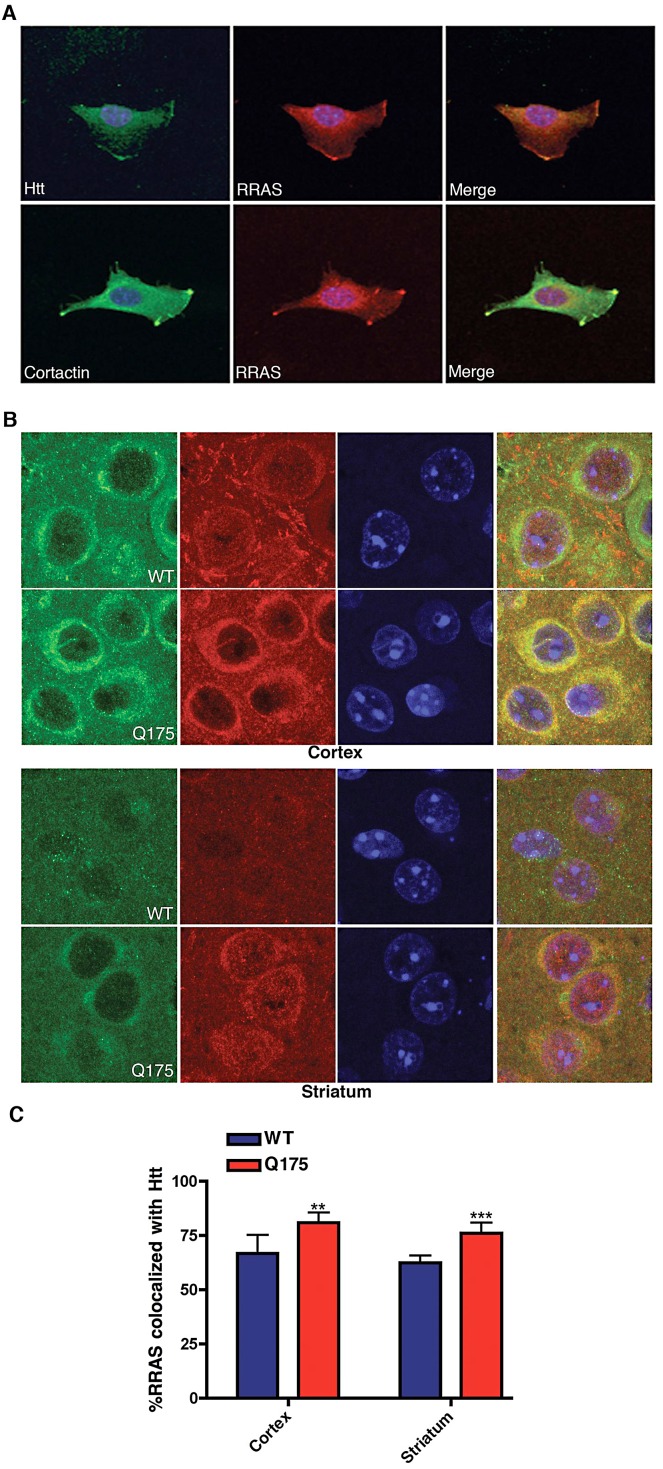
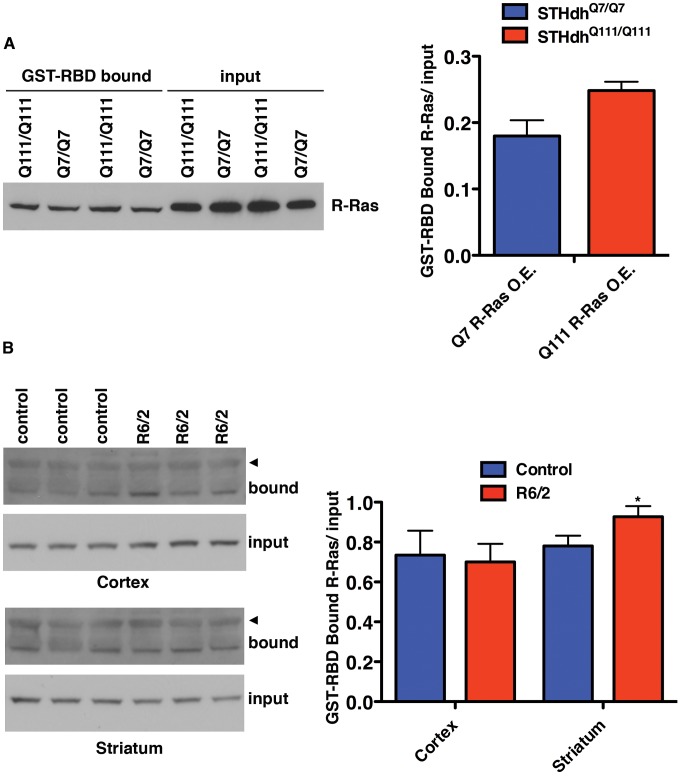
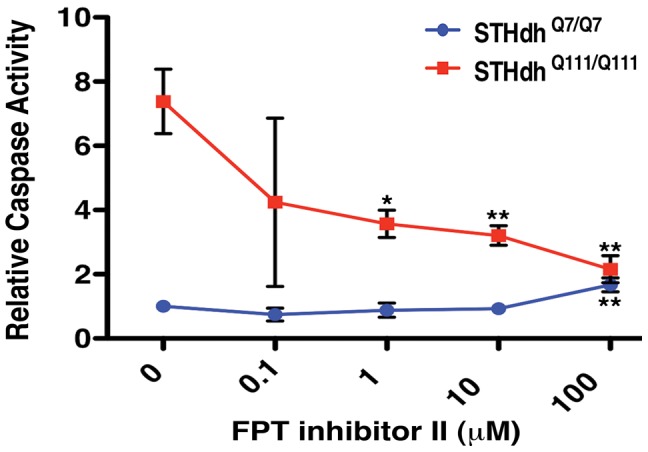
A genome-scale RNAi screen was performed in a mammalian cell-based assay to identify modifiers of mutant huntingtin toxicity. Ontology analysis of suppressor data identified processes previously implicated in Huntington's disease, including proteolysis, glutamate excitotoxicity, and mitochondrial dysfunction. In addition to established mechanisms, the screen identified multiple components of the RRAS signaling pathway as loss-of-function suppressors of mutant huntingtin toxicity in human and mouse cell models. Loss-of-function in orthologous RRAS pathway members also suppressed motor dysfunction in a Drosophila model of Huntington's disease. Abnormal activation of RRAS and a down-stream effector, RAF1, was observed in cellular models and a mouse model of Huntington's disease. We also observe co-localization of RRAS and mutant huntingtin in cells and in mouse striatum, suggesting that activation of R-Ras may occur through protein interaction. These data indicate that mutant huntingtin exerts a pathogenic effect on this pathway that can be corrected at multiple intervention points including RRAS, FNTA/B, PIN1, and PLK1. Consistent with these results, chemical inhibition of farnesyltransferase can also suppress mutant huntingtin toxicity. These data suggest that pharmacological inhibition of RRAS signaling may confer therapeutic benefit in Huntington's disease.


Conflict of interest statement

The authors have declared that no competing interests exist.

Figures

Figure 1
Figure 1. Gene Ontology Enrichment Analysis of HD Suppressors.
(A) Enriched GO categories for HD suppressor genes. Significance (line with open diamonds) is represented as the −log(Benjamini-Hochberg adjusted p-value), and is scaled on the secondary axis. The remaining bars represent the ratio of genes in each category vs. genes in each dataset. (B) Directed Acyclic Graph (DAG) of Glutamate Signaling Pathway GO category. Enriched subcategories are colored blue (for Biological Process). (C) DAG of Glutamate Receptor Complex GO category. Enriched subcategories are colored green (for Cellular Component). (D) DAG of Catalytic Activity GO category. Enriched categories are colored yellow (for Molecular Function). (E) (DAG) of neurological system process GO category. In graphs B, D and E, higher significance is indicated by more intense coloration. See also Table 1.
Figure 2
Figure 2. Ingenuity Pathway Analysis (IPA) of HD Suppressor Genes.
(A) IPA network of the HD suppressor genes that could be directly connected to each other without intervening nodes. This network was constructed using data from all Ingenuity model organisms. Huntingtin (HTT) was manually added to this network, and its connections colored red. Functions of nodes are indicated with icons. “Direct Relationship” (solid lines) indicates direct physical contact between two molecules, e.g. binding or phosphorylation. “Indirect Relationship” (dotted lines) indicates a functional interaction that does not require physical contact between the two molecules, e.g. signaling events. See also Figure S3.
Figure 3
Figure 3. RNAi Screen Identifies Multiple Members of RRAS Signaling Cascade as Modulators of Mutant Htt Toxicity.
(A) Results with siRNAs that target RRAS pathway proteins. Values are means and standard deviations observed in the primary screen and in the retest (caspase activity values are expressed as percent of non-targeting siRNA control). ND = not determined. Colored circles refer to Panel B. Additional results with relevant siRNAs are presented in Table S2. (B) Diagram showing the relationships of proteins that when inhibited in HEK293T cells (red) or STHdh Q111/Q111 cells (blue) by siRNA, or in Drosophila by RNAi or loss-of-function (LOF) alleles (olive; see Figure 4 and Figure S5) suppress mutant Htt toxicity. Gray lines indicate relationships from published observations that may not play a role in these HD cell models. References for the pathway interconnections are presented within the text and in Text S1. (C) Modifier effects of loss-of-function in Ras pathway components on motor impairment in Drosophila expressing mutant Htt. S = suppressor. Colored circles refer to Panel B.
Figure 4
Figure 4. Suppression of Htt Toxicity by Knock-Down of RRAS Signaling Is Conserved across HD Models.
(A) Knockdown of Ras signaling components in STHdh Q111/Q111 cells (n = 3). See Figure S4A for data using individual siRNAs from deconvoluted pools. (B) siRNA targeting of subunits of the farnesyltransferase enzyme in STHdh Q111/Q111 cells (n = 3). (C) Toxicity suppression is specific to RRAS knockdown among Ras family members tested (n = 3). *p<0.05, **p<0.01, ***p<0.001, ANOVA with Tukey's Multiple Comparison Test. Figure S4B shows confirmation of knockdown by western blot. (D–F) Loss-of-function in Ras signaling components Ras64B (RRAS), dod (PIN1), and polo (PLK1) suppress motor performance defects in Drosophila melanogaster caused by expression of mutant Htt (See Figure 3C; additional results are also presented in Figure S5). Error bars represent s.e.m.
Figure 5
Figure 5. Altered RAF1 Phosphorylation in HD Models Is Rescued by RRAS Inhibition.
(A) Ratio of phospho-S338 to total RAF1 is increased in STHdh Q111/Q111 cells due to a reduced level of total RAF1 (n = 3). (B) Enhanced phospho-S338/total RAF1 in transiently transfected HEK293T cells (n = 3). (C) The R6/2 mouse model of Huntington's disease has elevated ratios of phospho-S338 to total RAF1 in regions of the brain affected by the disease (n = 2). **p<0.01, ***p<0.001, ANOVA with Tukey's Multiple Comparison Test (A and B), Student's ttest (C).
Figure 6
Figure 6. Co-Localization of huntingtin and RRas in STHdh Q111/Q111 Cells and Q175 Knock-In Mouse Model.
(A) Mouse STHdh Q111/Q111 cell labeled with antibodies to huntingtin (upper left), RRAS (middle) and DAPI were imaged by confocal microscopy (upper panels). Lower panel shows STHdh Q111/Q111 cell labeled with cortactin (lower left), RRAS (middle) and DAPI imaged by confocal microscopy. Merged images are shown (right panels). (B) Immunohistochemistry of HdhQ175 (Q175) and littermate control brain (WT) cortex and striatum stained with anti-RRAS and anti-huntingtin antibodies at 7-months of age. (C) Quantification of colocalization of RRAS with Htt. **p<0.01, ***p<.005, Student's t-test.
Figure 7
Figure 7. Levels of Active R-Ras Are Elevated in HD Models.
(A) STHdh cells overexpressing R-Ras were subjected to GST-RBD pull-downs to detect the amount of GTP-bound R-Ras (n = 2). (B) The R6/2 mouse model of HD has increased GTP-bound R-Ras in the striatum (n = 3). The arrowheads indicate a higher molecular mass band of unknown origin that is only present in the pull-down samples. *p<0.05, Student's t-test.
Figure 8
Figure 8. Small Molecule Inhibition of Farnesyltransferase Rescues Toxicity in an HD Cell Model.
The farnesyltransferase inhibitor FPT inhibitor II rescues mutant Htt toxicity in STHdh Q111/Q111 cells in a dose-dependent manner (n = 3). *p<0.05, **p<0.01, ***p<0.001, ANOVA with Tukey's Multiple Comparison Test.

References

    1. The Huntington's Disease Collaborative Research Group, Cell 72, 971 (Mar 26, 1993). - PubMed
    1. de la Monte SM, Vonsattel JP, Richardson EP Jr (1988) Morphometric demonstration of atrophic changes in the cerebral cortex, white matter, and neostriatum in Huntington's disease. J Neuropathol Exp Neurol 47: 516–525. - PubMed
    1. Zuccato C, Ciammola A, Rigamonti D, Leavitt BR, Goffredo D, et al. (2001) Loss of huntingtin-mediated BDNF gene transcription in Huntington's disease. Science 293: 493–498. - PubMed
    1. Cha CI, Chung YH, Shin CM, Shin DH, Kim YS, et al. (2000) Immunocytochemical study on the distribution of nitrotyrosine in the brain of the transgenic mice expressing a human Cu/Zn SOD mutation. Brain Res 853: 156–161. - PubMed
    1. Weydt P, Pineda VV, Torrence AE, Libby RT, Satterfield TF, et al. (2006) Thermoregulatory and metabolic defects in Huntington's disease transgenic mice implicate PGC-1alpha in Huntington's disease neurodegeneration. Cell Metab 4: 349–362. - PubMed

Publication types

MeSH terms