. 2012;7(11):e48819.
doi: 10.1371/journal.pone.0048819. Epub 2012 Nov 28.

Uncovering the salt response of soybean by unraveling its wild and cultivated functional genomes using tag sequencing

Affiliations

Uncovering the salt response of soybean by unraveling its wild and cultivated functional genomes using tag sequencing

Zulfiqar Ali et al. PLoS One. 2012.

Abstract

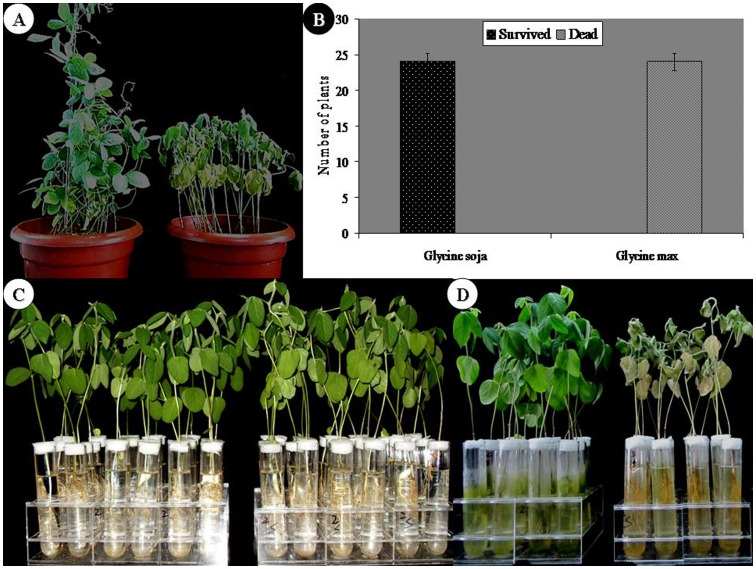
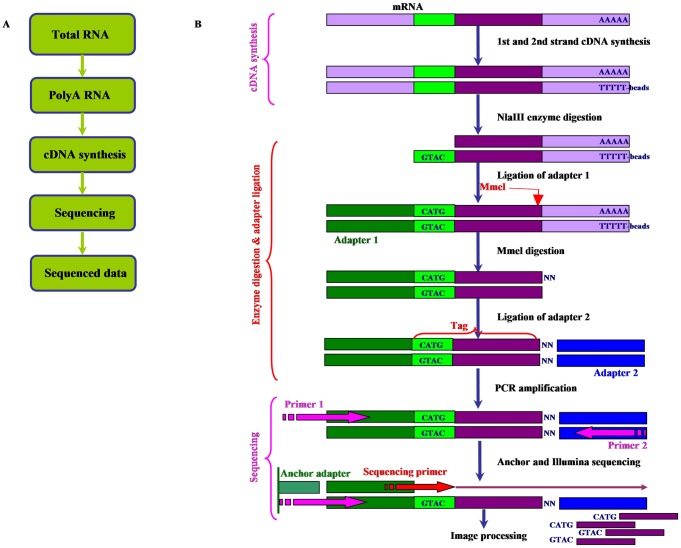
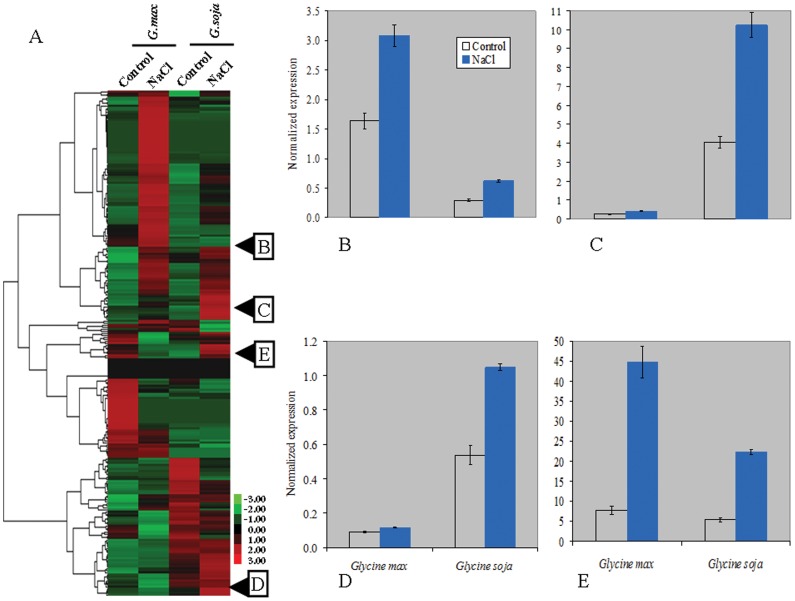
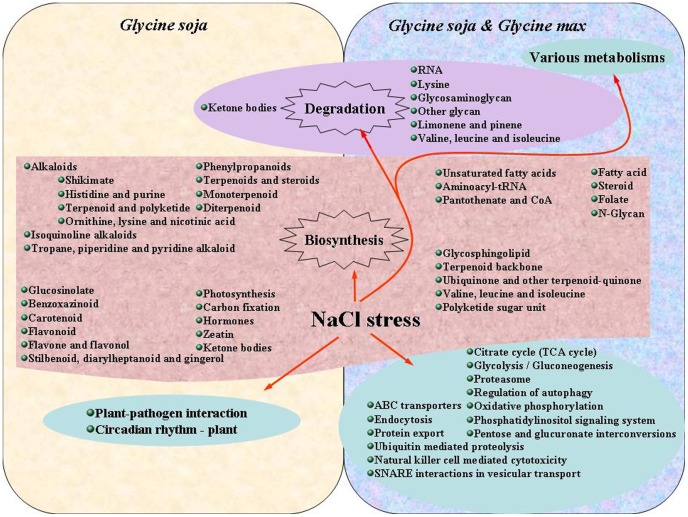
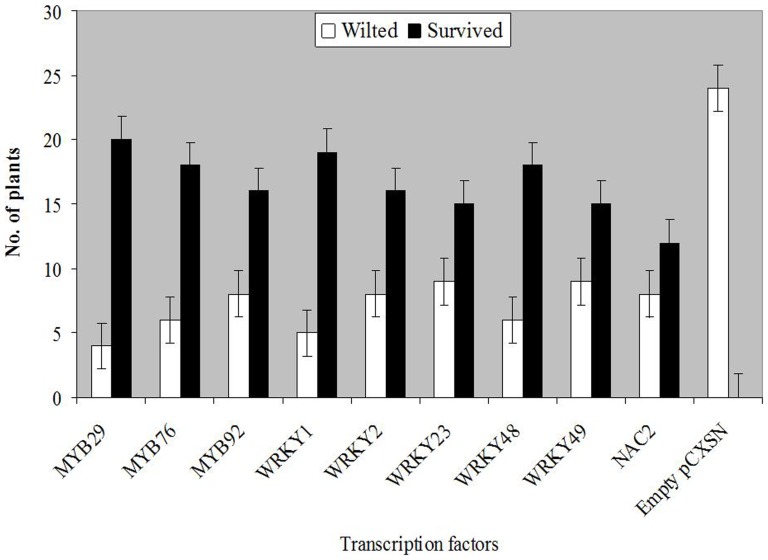
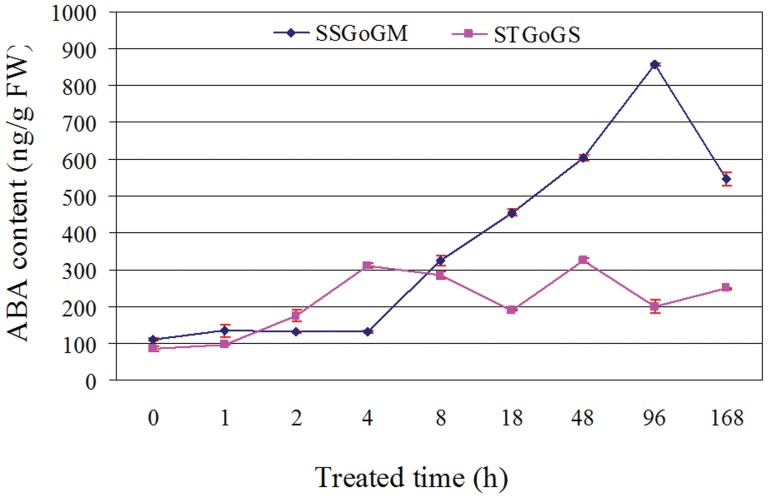
Soil salinity has very adverse effects on growth and yield of crop plants. Several salt tolerant wild accessions and cultivars are reported in soybean. Functional genomes of salt tolerant Glycine soja and a salt sensitive genotype of Glycine max were investigated to understand the mechanism of salt tolerance in soybean. For this purpose, four libraries were constructed for Tag sequencing on Illumina platform. We identify around 490 salt responsive genes which included a number of transcription factors, signaling proteins, translation factors and structural genes like transporters, multidrug resistance proteins, antiporters, chaperons, aquaporins etc. The gene expression levels and ratio of up/down-regulated genes was greater in tolerant plants. Translation related genes remained stable or showed slightly higher expression in tolerant plants under salinity stress. Further analyses of sequenced data and the annotations for gene ontology and pathways indicated that soybean adapts to salt stress through ABA biosynthesis and regulation of translation and signal transduction of structural genes. Manipulation of these pathways may mitigate the effect of salt stress thus enhancing salt tolerance.


Conflict of interest statement

Competing Interests: The authors have declared that no competing interests exist.

Figures

Figure 1
Figure 1. Response of wild and cultivated soybeans to NaCl stress.
A, Response of salt tolerant genotype of Glycine soja (STGoGS) and salt sensitive genotype of Glycine max (SSGoGM) treated with 200 mM NaCl for seven days. B, Statistical comparison of two genotypes. C, Two sets of healthy plants of SSGoGM before NaCl stress application. D, Comparison of SSGoGM plants grown in the absence and presence of NaCl stress.
Figure 2
Figure 2. Digital gene expression profiling (DGEP).
A, Outline of experimental process. B, Principle and procedure in detail; Beads of Oligo (dT) are used to enrich mRNA in the total RNA, and then are transferred into double-stranded cDNA through reverse transcription. Four base recognition enzyme NlaIII is used to digest this cDNA, and Illumina adapter 1 is linked. Mmel is used to digest at 17 bp downstream of CATG site; Illumina adapter 2 is linked at 3′ end. Primer GX1 and Primer GX2 are added for PCR. Then, regain 85 bp strips through 6% TBE PAGE. The DNA was purified and followed by Solexa sequencing.
Figure 3
Figure 3. Normalized expression of differentially expressed transcription genes in salt tolerant genotype of Glycine soja (STGoGS) and salt sensitive genotype of Glycine max (SSGoGM) under 0 and 200 mM NaCl stress.
A, hierarchical clustering of differentially expressed transcription genes based on their relative gene expression values (Z-score) computed using DGEP data. Red to green color indicates high to low expression levels. B to E, is relative expression based on qPCR data of GmMYB92, GmNAC2, GmWRKY and GmbZIP110, respectively while their position for the respective expression pattern in DGEP is also shown.
Figure 4
Figure 4. Pathways, annotated from KEGG database, enriched with differentially expressed genes specific to salt tolerant genotype of Glycine soja (STGoGS) and common in both.
Figure 5
Figure 5. Comparison of over-expression of nine transcription factors (TFs) under 200 mM NaCl stress tested in hairy root system of mosaic soybean plants.
On average of two independent repeats, 24 mosaic plants were tested for each TF except GmNAC2 whose 20 mosaic plants were tested. Standard errors are indicated with bars for statistical comparisons. The hairy roots of all survived mosaic plants were PCR positive while wilted one were PCR negative.
Figure 6
Figure 6. Over-expression analysis of GmWRKY, GmNAC2, GmbZIP110 and GmMYB92 under 200 mM NaCl stress.
Figure 7
Figure 7. ABA quantification in salt tolerant genotype of Glycine soja (STGoGS) and salt sensitive genotype of Glycine max (SSGoGM) under 200 mM NaCl stress at various time points.

References

    1. Flowers TJ, Yeo AR (1995) Breeding for salinity resistance in crop plants: where next?. Australian Journal of Plant Physiology 22: 875–884.
    1. Flowers TJ, Koyama ML, Flowers SA, Sudhakar C, Singh KP, et al. (2000) QTL: their place in engineering tolerance of rice to salinity. Journal of Experimental Botany 51: 99–106. - PubMed
    1. Cushman JC, Bohnert HJ (2000) Genomic approaches to plant stress tolerance. Current Opinion in Plant Biology 3: 117–124. - PubMed
    1. Tomy S, Chang Y-M, Chen Y-H, Cao J-C, Wang T-P, et al. (2009) Salinity effects on the expression of osmoregulatory genes in the euryhaline black porgy Acanthopagrus schlegeli . General and Comparative Endocrinology 161: 123–132. - PubMed
    1. Manaa A, Ben Ahmed H, Valot B, Bouchet JP, Aschi-Smiti S, et al. (2011) Salt and genotype impact on plant physiology and root proteome variations in tomato. Journal of Experimental Botany 62: 2797–2813. - PubMed

Publication types

MeSH terms