. 2012;7(11):e49274.
doi: 10.1371/journal.pone.0049274. Epub 2012 Nov 29.

Nuclear RNA sequencing of the mouse erythroid cell transcriptome

Affiliations

Nuclear RNA sequencing of the mouse erythroid cell transcriptome

Jennifer A Mitchell et al. PLoS One. 2012.

Abstract

In addition to protein coding genes a substantial proportion of mammalian genomes are transcribed. However, most transcriptome studies investigate steady-state mRNA levels, ignoring a considerable fraction of the transcribed genome. In addition, steady-state mRNA levels are influenced by both transcriptional and posttranscriptional mechanisms, and thus do not provide a clear picture of transcriptional output. Here, using deep sequencing of nuclear RNAs (nucRNA-Seq) in parallel with chromatin immunoprecipitation sequencing (ChIP-Seq) of active RNA polymerase II, we compared the nuclear transcriptome of mouse anemic spleen erythroid cells with polymerase occupancy on a genome-wide scale. We demonstrate that unspliced transcripts quantified by nucRNA-seq correlate with primary transcript frequencies measured by RNA FISH, but differ from steady-state mRNA levels measured by poly(A)-enriched RNA-seq. Highly expressed protein coding genes showed good correlation between RNAPII occupancy and transcriptional output; however, genome-wide we observed a poor correlation between transcriptional output and RNAPII association. This poor correlation is due to intergenic regions associated with RNAPII which correspond with transcription factor bound regulatory regions and a group of stable, nuclear-retained long non-coding transcripts. In conclusion, sequencing the nuclear transcriptome provides an opportunity to investigate the transcriptional landscape in a given cell type through quantification of unspliced primary transcripts and the identification of nuclear-retained long non-coding RNAs.


Conflict of interest statement

Competing Interests: The authors have declared that no competing interests exist.

Figures

Figure 1
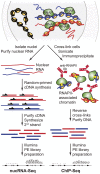
Figure 1. Outline of the experimental strategy.
The nuclear transcriptome as well as RNAPII-associated genomic sequences of actively transcribing cells are analysed by nucRNA-Seq and RNAPII ChIP-Seq, respectively, as indicated. Top: schematic representation of transcription in the nucleus: four transcribing RNAPII complexes depicted as green shapes are associated with two chromatin fibres, DNA shown in red and blue, respectively; a third chromatin region, which is not being transcribed, is shown with DNA in black; histone complexes are yellow circles, nascent transcripts are shown as thin wavy lines, colours corresponding to chromatin. The nucRNA-Seq procedure is outlined on the left; purified nuclear RNA from the two transcribed regions is shown as wavy or straight lines colour-coded as above, DNA is depicted as thicker lines, random primers are black arrows, a putative genomic region with aligned Illumina paired-end (PE) tags signifies nucRNA-Seq data. The RNAPII ChIP-Seq procedure is outlined on the right; immunoprecipitated RNAPII-associated nucleosomes are depicted and colour-coded as above with cross-links as yellow crosses, anti-RNAPII antibodies are shown as red Y shapes, purified DNA is represented by thick lines, a putative genomic region with PE tags signifies RNAPII ChIP-Seq data.
Figure 2
Figure 2. Validation of nuclear RNA material and sequence coverage at selected genes.
A) Quantitative PCR validation of transcript representation for cDNA samples used for construction of nucRNA-Seq libraries (F1.2, F2.2 and F3.2, F4 is the RT- sample for F1.2) relative to the housekeeping gene Gapdh was confirmed. Error bars depict one standard deviation calculated from three technical replicates. B) Quantitative PCR validation of nuclear/cytoplasmic fractionation. Nuclear and cytoplasmic RNA was reverse transcribed using random primers to generate cDNA. Absolute quantities of specific gene regions were determined in these samples by real-time PCR using genomic DNA standard curves. The relative amount in each fraction per ng of RNA is depicted. We found exonic sequences were distributed between the nuclear and cytoplasmic fractions while intronic sequences were found almost exclusively in the nuclear fraction. Furthermore, we found Air ncRNA almost exclusively in the nuclear fraction. C) Shown are selected genes: erythroid-specific (Hba cluster, Hmbs, Uros), ubiquitous (H2afx) and a brain-specific gene, Nefm that is not expressed in erythroid cells. Nuclear RNA sequence coverage is shown in blue. All genomic regions are depicted from centromere to telomere and the 5′ end of the gene is marked by the gene name.
Figure 3
Figure 3. Sequencing nuclear RNA reflects primary transcription at erythroid-expressed genes.
A) Exonic vs intronic coverage for annotated genes in the 5′ (red), body (orange) and 3′ (yellow) regions by splitting each gene into equal thirds. B) Examples of RNA FISH signals for Ank1 and Gypa shown in green, Hbb-b1 is shown in red, nuclear DAPI staining is shown in blue, scale bar = 1 µm. C) Transcription frequency determined by RNA FISH compared to gene coverage in nucRNA-Seq data. We found a significant log-linear association between the transcription frequency determined by RNA FISH and the maximum nucRNA coverage depth (rs = 0.820, 95% CI [0.582, 0.928], p<0.01).
Figure 4
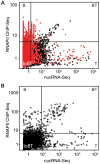
Figure 4. Comparison between RNAPII ChIP-Seq and nuclearRNA-Seq coverage.
A) RNAPII vs nucRNA scores were calculated as the maximum coverage depth within non-overlapping 10 kb windows, normalised to the genomic input score. Threshold values for identifying highly enriched regions were calculated using the boxplot method (thresholds set as Q3+(1.5×IQR), where Q3 is the upper quartile limit and IQR the interquartile range) and are represented as black bars. Windows containing an annotated gene are depicted as black circles, windows lacking an annotated gene are depicted as red circles. Regions were classed as either being highly RNAPII-bound and transcribed (BT); highly transcribed, but with low RNAPII binding (T); or highly bound, but not highly transcribed (B); low levels of both RNAPII association and transcription (loBT). B) Scores were calculated for annotated genes only, as described above.
Figure 5
Figure 5. RNAPII peaks are associated with both the promoter and the 3′ end of genes.
A) Promoter-proximal (±300 bp) stalling index plotted against RNAPII and nucRNA coverage at annotated genes. B) 3′ end (±300 bp) stalling index plotted against RNAPII and nucRNA coverage at annotated genes. C) nucRNA to RNAPII coverage ratio for the promoter (pr), 3′ end (3′) and double RNAPII peak (pr/3′) categories as well as at genes with low stalling indices at both ends (no).
Figure 6
Figure 6. RNAPII is associated with enhancer regions.
A) The Hbb (β-globin) LCR, located upstream of the Hbb genes, contains six characterized erythroid-specific DNase I hypersensitive sites (HS1-6). Peaks of RNAPII (green) identified using SISSRs overlapped HS1-4. Erythroid-expressed transcription factors have also been found associated with the LCR, overlapping the HS and RNAPII peaks. RNAPII ChIP sequences are shown in green, genomic DNA input sequences are shown in black and nucRNA sequences (only three in this region) are shown in blue. B) Distribution of RNAPII+/nucRNA- peaks relative to annotated genes. Roughly half of the RNAPII peaks identified by SISSRs are located in intergenic regions with 32.5% located more than 10 kb from an annotated gene (intergenic). C) Overlap of RNAPII+/nucRNA- peaks with erythroid-expressed transcription factors and conserved regions. D) An RNAPII+/nucRNA- peak 77 kb upstream of the Lmo2 gene overlaps TF binding sites and is homologous to a validated enhancer identified in the human genome. Enhancer homology regions are indicated by black boxes joined by a line to delineate the human enhancer construct used in the generation of transgenic mice. NucRNA and RNAPII peaks surrounding the Lmo2 gene are shown in blue and green respectively.
Figure 7
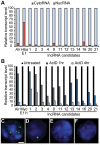
Figure 7. Transcribed intergenic regions correspond to long non-coding RNAs.
A) Nuclear vs cytoplasmic distribution for lncRNA candidates determined by RT-qPCR. B) Stability of nuclear retained lncRNA candidates was assessed by treatment with ActD for 1 and 4 hrs. Transcript levels were determined by RT-qPCR. Intranuclear distribution of lncRNA candidates was determined by RNA FISH for: C) lncRNA1 (Malat1), D) lncRNA2 (Neat1), E) lncRNA9, and F) lncRNA11, scale bar = 2 µm.

References

    1. Carninci P, Kasukawa T, Katayama S, Gough J, Frith MC, et al. (2005) The transcriptional landscape of the mammalian genome. Science 309: 1559–1563. - PubMed
    1. Birney E, Stamatoyannopoulos JA, Dutta A, Guigo R, Gingeras TR, et al. (2007) Identification and analysis of functional elements in 1% of the human genome by the ENCODE pilot project. Nature 447: 799–816. - PMC - PubMed
    1. Cheng J, Kapranov P, Drenkow J, Dike S, Brubaker S, et al. (2005) Transcriptional maps of 10 human chromosomes at 5-nucleotide resolution. Science 308: 1149–1154. - PubMed
    1. Buratowski S (2009) Progression through the RNA polymerase II CTD cycle. Mol Cell 36: 541–546. - PMC - PubMed
    1. Kim JH, Tuziak T, Hu L, Wang Z, Bondaruk J, et al. (2005) Alterations in transcription clusters underlie development of bladder cancer along papillary and nonpapillary pathways. Lab Invest 85: 532–549. - PubMed

Publication types