. 2012;7(11):e50269.
doi: 10.1371/journal.pone.0050269. Epub 2012 Nov 28.

Population differentiation of southern Indian male lineages correlates with agricultural expansions predating the caste system

Collaborators, Affiliations

Population differentiation of southern Indian male lineages correlates with agricultural expansions predating the caste system

Ganeshprasad Arunkumar et al. PLoS One. 2012.

Erratum in

  • PLoS One. 2013;8(7). doi:10.1371/annotation/8663819b-5ff0-4133-b70a-2d686dfb0a44

Abstract

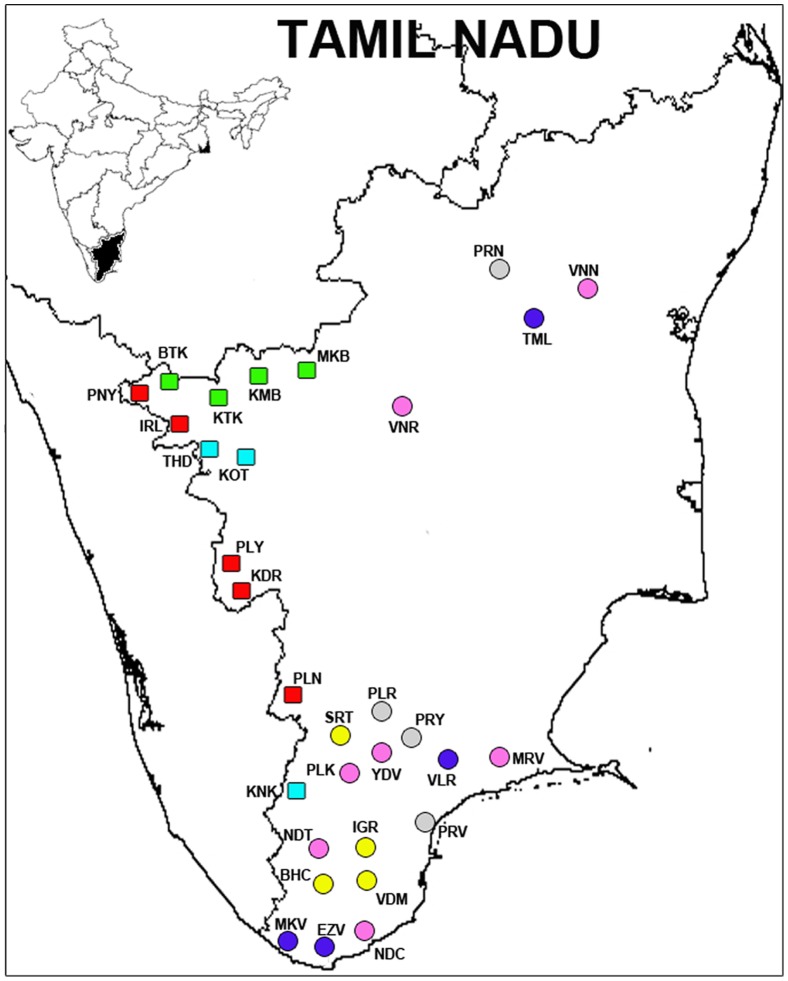
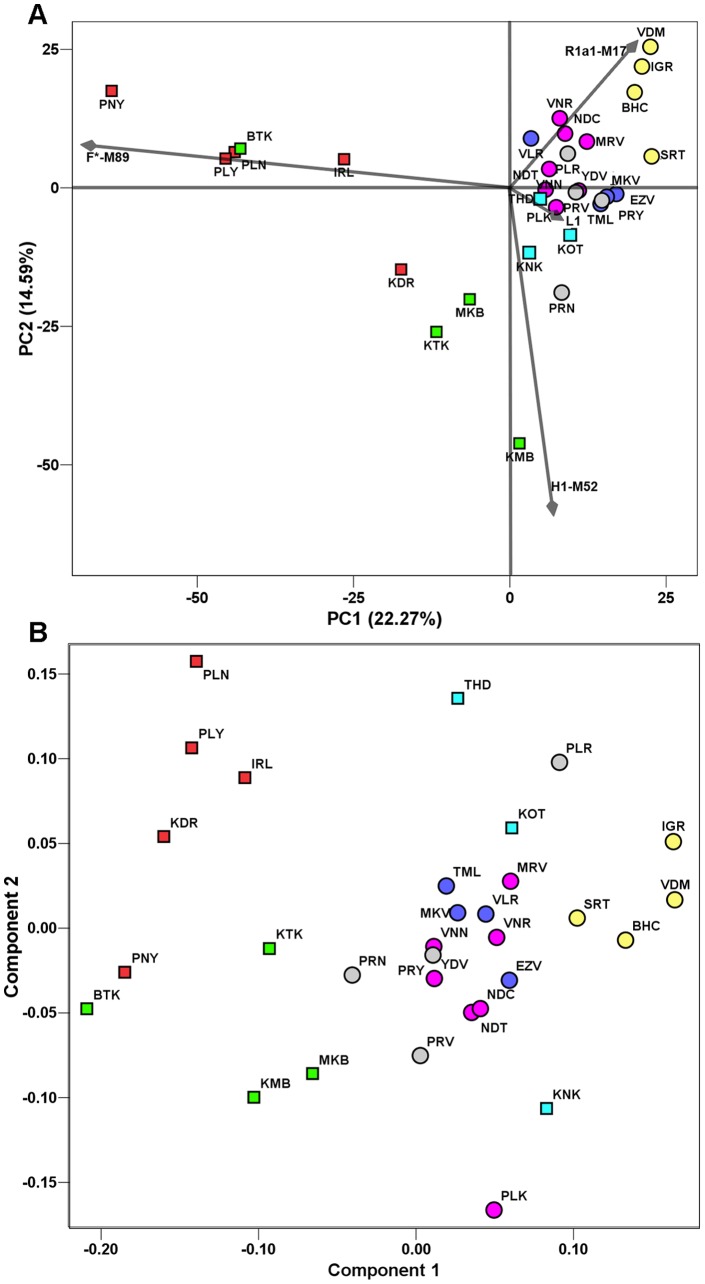
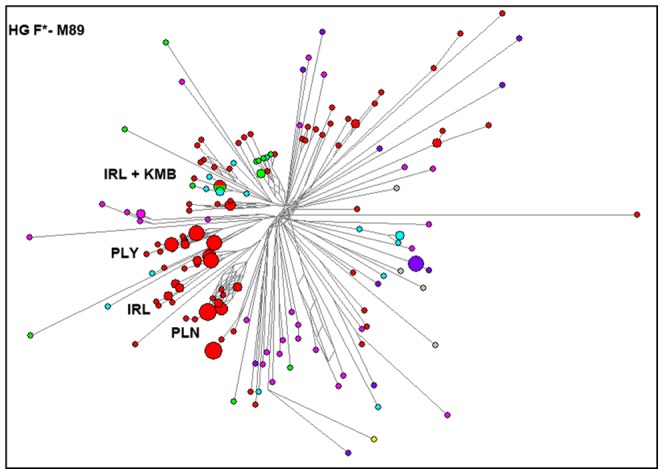
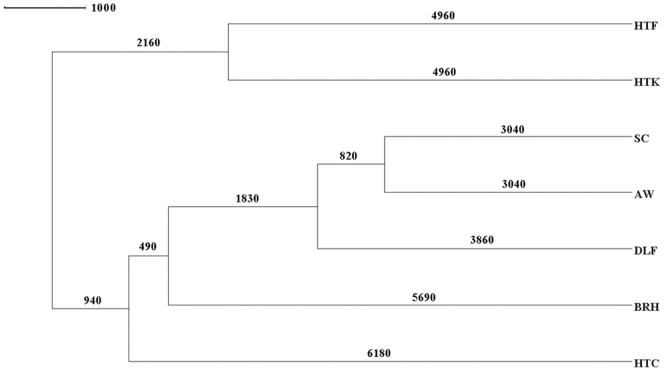
Previous studies that pooled Indian populations from a wide variety of geographical locations, have obtained contradictory conclusions about the processes of the establishment of the Varna caste system and its genetic impact on the origins and demographic histories of Indian populations. To further investigate these questions we took advantage that both Y chromosome and caste designation are paternally inherited, and genotyped 1,680 Y chromosomes representing 12 tribal and 19 non-tribal (caste) endogamous populations from the predominantly Dravidian-speaking Tamil Nadu state in the southernmost part of India. Tribes and castes were both characterized by an overwhelming proportion of putatively Indian autochthonous Y-chromosomal haplogroups (H-M69, F-M89, R1a1-M17, L1-M27, R2-M124, and C5-M356; 81% combined) with a shared genetic heritage dating back to the late Pleistocene (10-30 Kya), suggesting that more recent Holocene migrations from western Eurasia contributed <20% of the male lineages. We found strong evidence for genetic structure, associated primarily with the current mode of subsistence. Coalescence analysis suggested that the social stratification was established 4-6 Kya and there was little admixture during the last 3 Kya, implying a minimal genetic impact of the Varna (caste) system from the historically-documented Brahmin migrations into the area. In contrast, the overall Y-chromosomal patterns, the time depth of population diversifications and the period of differentiation were best explained by the emergence of agricultural technology in South Asia. These results highlight the utility of detailed local genetic studies within India, without prior assumptions about the importance of Varna rank status for population grouping, to obtain new insights into the relative influences of past demographic events for the population structure of the whole of modern India.


Conflict of interest statement

Competing Interests: Janet S. Ziegle is an employee of Applied Biosystems. Ajay K. Royyuru, Laxmi Parida and Daniell E. Platt are employees of IBM. Asif Javed and Pandikumar Swamikrishnan, both members of the Genographic Consortium are also employees of IBM. There is no patenting or profit making to be declared. This does not alter the authors' adherence to all the PLOS ONE policies on sharing data and materials.

Figures

Figure 1
Figure 1. Tamil Nadu map showing the sampling location of the 12 tribal (squares) and 19 non-tribal (circles) populations.
The majority of tribal populations are located in the mountains of the Western Ghats. The color codes are: Red – Hill Tribe Foragers (HTF); Turquoise – Hill Tribe Cremating (HTC); Green – Hill Tribe Kannada (HTK); Grey – Schedule Castes (SC); Pink – Dry-Land Farmers (DLF); Deep Blue – Artisan and Warriors (AW) and Yellow – Brahmin related (BRH). Population abbreviations are as shown in Table 1.
Figure 2
Figure 2. Plots representing the genetic relationships among the 31 tribal and non-tribal populations of Tamil Nadu.
(A) PCA plot based on HG frequencies. The two dimensions display 36% of the total variance. The contribution of the first four HGs is superimposed as grey component loading vectors: the HTF populations clustered in the direction of the F-M89 vector, HTK in the H1-M52 vector, BRH in the R1a1-M17 vector, while the HG L1-M27 is less significant in discriminating populations. (B) MDS plot based on 17 microsatellite loci Rst distances. The two tribal groups (HTF and HTK) are clustered at the left side of the plot while BRH form a distant cluster at the opposite side. The colors and symbols are the same as shown in Figure 1, while population abbreviations are as shown in Table 1.
Figure 3
Figure 3. Reduced median network of 17 microsatellite haplotypes within haplogroup F-M89.
The network depicts clear isolated evolution among HTF populations with a few shared haplotypes between Kurumba (HTK) and Irula (HTF) populations. Circles are colored based on the 7 Major Population Groups as shown in Figure 1, and the area is proportional to the frequency of the sampled haplotypes. Branch lengths between circles are proportional to the number of mutations separating haplotypes.
Figure 4
Figure 4. Modal tree obtained by BATWING indicating the coalescence time divergence estimates (in years) among Major Populations Groups (MPG) after using 17 STRs from all haplogroups.
BATWING estimates suggest that all populations groups started to diverge 7.1 Kya (95% CI: 5.5–9.2 Kya), with limited admixture among them for the last 3.0 Kya (2.3–4.3 Kya), the youngest diverge time estimate. The modal tree shows two differentiated nodes with clear overlapping estimates of the splits: a first node including one of the tribal groups (HTC) together with all the non-tribal MPGs (castes) with a divergence time of 6.2 Kya (4.7–8.0 Kya), while the second node embraces the HTF and HTK tribal groups with an estimated divergence between then of 4.9 Kya (3.6–7.1 Kya).

References

    1. Cavalli-Sforza LL, Menozzi P, Piazza A (1994) The History and Geography of Human Genes. Princeton, NJ.: Princeton University Press.
    1. Majumder PP (2010) The human genetic history of South Asia. Curr Biol 20: R184–187. - PubMed
    1. Singh KS (2002) People of India: An Introduction, Revised edition: Oxford Uniersity Press.
    1. Metspalu M, Kivisild T, Metspalu E, Parik J, Hudjashov G, et al. (2004) Most of the extant mtDNA boundaries in south and southwest Asia were likely shaped during the initial settlement of Eurasia by anatomically modern humans. BMC genetics 5: 26. - PMC - PubMed
    1. Kivisild T, Rootsi S, Metspalu M, Mastana S, Kaldma K, et al. (2003) The genetic heritage of the earliest settlers persists both in Indian tribal and caste populations. Am J Hum Genet 72: 313–332. - PMC - PubMed

Publication types

Substances